# GHG quantification

## General

General GHG reduction quantification rules can be found in the [Rainbow Standard Rules](/rainbow-standard-documents/rainbow-standard-rules/ghg-quantification.md).

Calculations of GHG emissions for the baseline and project scenarios shall follow the method detailed below, based on [ISO 14064-2:2019](#user-content-fn-1)[^1].

Electronic device refurbishing projects are only eligible for **avoidance Rainbow Carbon Credits**.

Electronic device refurbishing projects serve two functions: **waste treatment from a device’s first life** (Device A), and the **provisioning of a “new” device** in its second life (Device B). Both of these functions are included in the project and baseline scenario. See Figure 1 and Figure 2 for a depiction of project and baseline scenario system boundaries.

The baseline scenario represents the **functionally equivalent** set of activities that would occur in the absence of the project. Therefore, the baseline scenario is the average e-waste treatment of Device A, and the market mix for production of a new Device B. **This market mix includes the fraction of refurbished devices that are already on the market** (see [Appendix 6](/methodologies/refurbishing-of-electronic-devices/appendix.md#id-5lf32r1yzlvs))**.**

The distribution, packaging, use, and waste treatment of Device B are not included in the calculations because they are assumed to be the same in both scenarios. Therefore, **the downstream system boundary is Device B at the factory gate**.

Calculations and data collection are based on annual project operations.

## Functional Unit

Electronic device refurbishing projects are multifunctional (see General section above) so the **functional unit is twofold:**

* production of one electronic device (Device B), plus
* treatment of the corresponding amount of e-waste treated (from Device A) to generate this one device.

## Data Sources

The required **primary data** for GHG reduction calculations from projects are presented in Table 2:

*Table 2 Summary of primary data needed from projects and their source. Asterisks (\*) indicate which data are required to be updated annually during verification (see Monitoring Plan section).*

<table data-header-hidden><thead><tr><th width="397"></th><th width="173"></th><th></th></tr></thead><tbody><tr><td><strong>Parameter</strong></td><td><strong>Unit</strong></td><td><strong>Source proof</strong></td></tr><tr><td>Amount of sold devices (sold in a functioning state) during the reference year, by type and sourcing country (listed in Table 3).*</td><td>Units of device, by type</td><td>Track records from the refurbishing site</td></tr><tr><td>Mass of devices (optional)</td><td>grams/device type</td><td>Internal document containing this parameter</td></tr><tr><td>Distance traveled during collection from the sourcing place/country until the refurbishing site, and mode of transport (road or air freight).*</td><td>km</td><td>Track records from the refurbishing site</td></tr><tr><td>If applicable, secondary transport to send collected devices from the project site to another more specialized refurbishing site.*</td><td>Number of devices by type, and distance (km)</td><td>Track records from the refurbishing site/invoices</td></tr><tr><td><p>Percent of input used devices, broken down by device type, that undergo:</p><ul><li>light refurbishment,</li><li>full refurbishment,</li><li>are recycled, and</li><li>are saved for spare parts or sold as non-functional devices.*</li></ul></td><td>Percentage (%)</td><td>Track records from the refurbishing site</td></tr><tr><td>(Optional) The average buyback price per device category.</td><td><p>Currency</p><p>(Euro - € or dollar - $)</p></td><td>Invoices</td></tr></tbody></table>

**Secondary data** taken from the literature are used to define default values for the following elements:

* Device expected lifetime (new and refurbished)
* Device mass (if not provided by the Project Developer)
* Emission factors from device production (when not available in the ecoinvent database, see paragraph below)

These values and their sources are provided in Table 3 in the [#assumptions](#assumptions "mention") section

The [ecoinvent ](#user-content-fn-2)[^2]database version 3.12 (hereafter referred to as ecoinvent) shall be the main source of emission factors unless otherwise specified. Ecoinvent is preferred because it is traceable, reliable, and well-recognized. The ecoinvent processes selected are detailed in [Appendix](/methodologies/refurbishing-of-electronic-devices/appendix.md#jfq1kp34xji7)

## Assumptions

1. Electronic devices are evaluated in categories of device types rather than specific device models to facilitate data collection. It is assumed that **devices in the same device type category have** **similar characteristics** (mass, emission factor, lifetime), as defined in Table 3. Only the device type "monitor" is separated into large and small monitors, due to the influence of monitor size on manufacturing impacts.
2. Some devices are not able to be refurbished to a functioning state, but contain some functional parts. Typically, the device is disassembled to harvest those scrap parts to use as spare parts for other refurbished devices. To maintain a conservative approach, these devices are assumed to go to electronic waste recycling.
3. In the baseline scenario, the distance for e-waste collection of Device A and transport to the waste treatment center is assumed to be 100 km.
4. The distribution of devices in the baseline and project scenarios is assumed to be the same, and is therefore excluded from quantifications. This is a conservative assumption, because [new devices in the baseline scenario are likely manufactured in Asia or the USA](#user-content-fn-3)[^3] and transported long distances. In contrast, the project scenario consists of mostly inter-EU shipping of devices across much shorter distances.
5. Packaging, use, and waste treatment of Device B are assumed to be the same in the baseline and project scenarios, and are therefore excluded from quantifications.
6. Refurbished devices are assumed to have shorter lifetimes than new devices, as presented in Table 3. To account for this difference, it is assumed that **the amount of device production avoided in the baseline scenario is proportional to the ratio of new and refurbished device lifetimes**. See the [Baseline Scope ](/methodologies/refurbishing-of-electronic-devices/eligible-technologies.md#baseline-scope)section for more details. Lifetimes for Apple and non-Apple devices are assumed to be the same.
7. Detailed project data on the refurbishing process is rarely available. It is a manual process, and most impacts in the life cycle come from production of spare parts. Therefore, **impacts of the refurbishing process are assumed to equal the ratio of impacts of new and refurbished devices** in the detailed life cycle assessment on electronic device refurbishing, published by The French Agency for Ecological Transition (*Agence de la transition écologique, ADEME*), referred to hereafter as the [ADEME study](#user-content-fn-4)[^4]. Refurbishing impact ratios for Apple and non-Apple devices are assumed to be the same. See [#refurbishing-process](#refurbishing-process "mention") Full refurbishment impacts section, for more details.
8. For the device type "monitor", if Project Developers do not have monitor/screen size data and are therefore unable to provide a distribution of monitor/screen sizes, it is assumed that all monitors fall into the <25" screen category. This assumption is conservative, as smaller monitors are associated with lower impacts from new device production, resulting in reduced avoided emissions.

*Table 3 Summary of assumed lifetimes, masses, and emission factors of new and refurbished electronic devices. Refer to the* [*Appendices* ](/methodologies/refurbishing-of-electronic-devices/appendix.md)*for details and sources.*

<table data-header-hidden data-full-width="true"><thead><tr><th></th><th></th><th></th><th></th><th></th><th></th></tr></thead><tbody><tr><td><strong>Device type</strong></td><td><a data-footnote-ref href="#user-content-fn-5"><strong>Emissions new (kgCO2eq)</strong></a></td><td><a data-footnote-ref href="#user-content-fn-6"><strong>Emissions refurbished (kgCO2eq)</strong></a></td><td><a data-footnote-ref href="#user-content-fn-7"><strong>Average mass (kg)</strong></a></td><td><a data-footnote-ref href="#user-content-fn-8"><strong>Lifetime new (year)</strong></a></td><td><a data-footnote-ref href="#user-content-fn-8"><strong>Lifetime refurbished (year)</strong></a></td></tr><tr><td>Smartphone</td><td>49</td><td>4</td><td>0.2</td><td>3</td><td>2</td></tr><tr><td>iPhone</td><td>64</td><td>5</td><td>0.2</td><td>3</td><td>2</td></tr><tr><td>Laptop</td><td>167</td><td>18</td><td>1.6</td><td>5</td><td>3</td></tr><tr><td>MacBook</td><td>158</td><td>17</td><td>1.7</td><td>5</td><td>3</td></tr><tr><td>PC</td><td>225</td><td>23</td><td>5.4</td><td>5</td><td>3</td></tr><tr><td>iMac</td><td>250</td><td>26</td><td>4.5</td><td>5</td><td>3</td></tr><tr><td>Tablet</td><td>84</td><td>10</td><td>0.5</td><td>3</td><td>2</td></tr><tr><td>iPad</td><td>58</td><td>7</td><td>0.5</td><td>3</td><td>2</td></tr><tr><td>Gaming console</td><td>293</td><td>67</td><td>3.0</td><td>5</td><td>3</td></tr><tr><td>Monitor &#x3C;25 cm</td><td>357</td><td>36</td><td><a data-footnote-ref href="#user-content-fn-9">4.5</a></td><td>7</td><td>4</td></tr><tr><td>Monitor >25 cm</td><td>538</td><td>54</td><td>6.6</td><td>7</td><td>4</td></tr></tbody></table>

**Residual value of input devices** is detailed in [#refurbishing-process](#refurbishing-process "mention"), Residual value of input devices section and refers to the allocation of impacts from the production of Device A to the refurbished Device B, based on its residual economic value. This is calculated using the ratio of the buyback price to the price of the newly manufactured device. This ratio is calculated for each device type, and assumed to be the same for all models within that category.

## Project Scenario

![Figure 1 The system boundary and scope of the project scenario are shown. They are broken down into three life cycle stages, each described in the corresponding sections below. X% allocation is described in  section](/files/h8aEFdnFdf2efJ2xvi26)

The project scenario consists of refurbishing used electronic devices, which serves two functions: **1) waste treatment of the device after its first life** (Device A) and **2) refurbishing to produce a “new“ device** (Device B). This process is broken down into 3 life cycle stages, and displayed in Figure 1:

* Device A e-waste collection
* Device A e-waste treatment of scrap materials
* Device B refurbishing process

### E-waste collection

The mass of e-waste collected equals the total mass of input used devices collected at the refurbishing site annually.

Total mass of devices shall be calculated using the number of devices collected for each device type (provided by the Project Developer), multiplied by the assumed mass of each device type shown in Table 3.

For calculating transport distance, Project Developers shall provide the country and/or city where used electronic devices are transported from, and provide the average distance from the collection source to the refurbishing project site.

It is assumed that transport within Europe is done 100% by truck, and overseas transport is done by long-distance air freight.

<details>

<summary><strong>Calculations project e-waste collection</strong></summary>

This step calculates the GHG emissions from transporting used devices during the collection process ($$Total$$ $$E\_{P.collection}$$).

$$\textbf{(Eq.1)}\ N\_{i.\ collected} = \sum({\ N}*{i.sold\ }/\ (1\ - \ Re*{rate.\ i}))$$

where,

* $$N\_{i.\ collected}$$ represents the amount of input collected devices of type $$i$$ collected by the project, in number of devices.
* $$N\_{i.\ sold}$$ represents the number of devices by type $$i$$ sold in a functioning state, and shall be provided by the Project Developer for each verification.
* $${{Re}*{rate.i}}*{\ }$$represents the fraction of input used devices of device type *i* that are recycled, saved for spare parts, or not successfully refurbished to a functioning state by the project, and shall be provided by the Project Developer for each verification.

$$\textbf{(Eq.2)}\ Total\ E\_{P.collection} = \sum(N\_{i.collected}\*W\_{i}\*D\_{C.i}*R\_{C.i})*\ EF\_{\ transport}$$

where,

* $${Total\ E}\_{P.collection\ }$$ represents the sum of GHG emissions due to the transport of devices collected for refurbishing in the project scenario, in kgCO$$\_2$$eq.
* $$N\_{i.collected}$$ was calculated in Equation 1.
* $$W\_{i}$$ represents the weight in kilograms of device *i*, according to the presented in Table 3.
* $$D\_{C.i}$$ represents the distance traveled for device collection in km, provided by the Project Developer per sourcing country/city ($$C$$) and device type ($$i$$).
* $$R\_{C.i}$$ represents the fraction of the devices collected per sourcing country/city ($$C$$) and device type ($$i$$).
* $$\ EF\_{\ transport}$$ represents the emission factor for transport in kgCO$$\_2$$eq/kg.km according to the ecoinvent database and includes truck or air freight. Refer to [Appendix](/methodologies/refurbishing-of-electronic-devices/appendix.md#jfq1kp34xji7) for the ecoinvent processes used.

</details>

### E-waste treatment of non-refurbished devices <a href="#cjv1j3sjdull" id="cjv1j3sjdull"></a>

Devices collected by the project that cannot be refurbished undergo e-waste recycling. Refurbishing projects typically have contracts with e-waste recycling companies that collect and recycle such devices.

Project Developers shall provide the fraction of devices that are recycled, and they will be modeled as mechanical e-waste recycling with shredding and separation (see ecoinvent processes in [Appendix 1](/methodologies/refurbishing-of-electronic-devices/appendix.md#jfq1kp34xji7)).

Some non-refurbished devices may be kept onsite to harvest spare parts in the future, but due to limited project data on this topic, they are assumed to be recycled.

Devices that are sold by the project in a non-functional state shall be treated in the calculations as recycled devices.

<details>

<summary><strong>Calculations project e-waste treatment</strong></summary>

This step calculates the GHG emissions from transporting and recycling the used electronic devices that are unsuitable for being refurbished ($${Total\ E}\_{P.waste\ treatment}$$).

$$\textbf{(Eq.3)}\ E\_{recycling} = \sum(N\_{i.collected}\*W\_{i}*Re\_{rate.i}*\ EF\_{recycling.\ i})$$

where,

* $$E\_{recycling}$$ represents the sum of GHG emissions due to the recycling process of devices/scrap not suitable for refurbishing, in kgCO$$\_2$$eq.
* $$N\_{i.collected}$$ and $${{Re}*{rate.i}}*{\ }$$ were described in Equation 1.
* $$W\_{i}$$ is described in the section [#calculations-project-e-waste-collection](#calculations-project-e-waste-collection "mention") section of the Project scenario.
* $$EF\_{recycling.\ i}$$represents the emission factor of recycling each device type. Refer to [Appendix 1](/methodologies/refurbishing-of-electronic-devices/appendix.md#jfq1kp34xji7) for the ecoinvent processes used.

$$\textbf{(Eq.4)}\ E\_{transport} = \sum(N\_{i.collected}\*W\_{i}\*Re\_{rate.i})*D\_{scrap}*\ EF\_{\ truck\ transport}$$

where,

* $$E\_{transport}$$ represents the sum of GHG emissions due to the transport of devices/scrap not suitable for refurbishing that are sent to recycling, in kgCO$$\_2$$eq
* $$N\_{i.collected}$$ and $${{Re}*{rate.i}}*{\ }$$ were described in Equation 1.
* $$W\_{i}$$ is described in the section[#calculations-project-e-waste-collection](#calculations-project-e-waste-collection "mention").
* $${D\_{scrap}}\_{\ }$$represents the distance in km until the waste treatment facility. If not known, this value is considered 100km.
* $$EF\_{truck\ transport}$$represents the emission factor of truck transport. Refer to [Appendix 1](/methodologies/refurbishing-of-electronic-devices/appendix.md#jfq1kp34xji7) for the ecoinvent processes used.

$$\textbf{(Eq.5)}\ Total\ E\_{P.waste\ treatment} = \ E\_{recycling\ } + E\_{transport}$$

where,

* $$\ Total\ E\_{P.waste\ treatment}$$represents the sum of GHG emissions in the project scenario e-waste treatment of non-refurbished devices, in kgCO$$\_2$$eq.

</details>

### Refurbishing process

This life cycle stage is composed of four main processes, each described below:

* light refurbishing impacts
* full refurbishing impacts
* residual value of input devices, and
* secondary transport of devices.

**Light refurbishment impacts:** The refurbishing process is split into two categories: light and full refurbishment, representing the degree of intervention needed to restore the device to a functioning state. Light refurbishment involves testing device functionality, and cosmetic and software improvements, and does not require the replacement of parts (e.g. new battery, new screen…). This distinction was chosen because [most environmental impacts](#user-content-fn-10)[^10] from the refurbishing process come from production of new replacement pieces.

* Light refurbishment includes inputs of electricity for testing and software improvement, and cleaning alcohol, tissues, and cloth for cleaning, and is modeled after the detailed LCA of electronic device refurbishing from the ADEME study.

**Full refurbishment impacts:** Full refurbishment includes light refurbishment plus repair and replacement of non-functional pieces. Detailed project data on all replacement pieces and inputs are rarely available, so full refurbishment impacts are modeled following the ADEME study.

* Results from this study are used to obtain the **ratio of impacts of a refurbished device to the impacts of the corresponding new device** ([Appendix 3](/methodologies/refurbishing-of-electronic-devices/appendix.md#id-21d91pp0841i))**.** This ratio is then applied to the new device production impacts summarized in Table 3 to obtain the desired amount of emissions from refurbishing. The emissions from refurbishing are modeled using the mix of ecoinvent processes used in light refurbishment described above, plus production of commonly replaced parts including screens, batteries, microphones and speakers.

{% hint style="info" %}
For example, the ADEME study found that production of a new laptop emitted 168 kgCO<sub>2</sub>eq, and the process for refurbishing a laptop emitted 18 kgCO<sub>2</sub>eq, so the refurbishing impact ratio of laptops is 11%.

In this model, the emission factors used for new laptop and Macbook production are 170 and 161 kgCO<sub>2</sub>eq. These are multiplied by the refurbishing impact ratio of 11% to obtain refurbishing impacts of one laptop and Macbook of 19 and 18 kgCO<sub>2</sub>eq.
{% endhint %}

**Residual value of input devices:** In life cycle assessments, when a project uses waste as an input, it typically enters the project system boundary with zero environmental impacts. Refurbishing projects collect and refurbish used devices that are not always at the end of their life, and **are not truly waste**. They may still be functional and hold residual value from their first life. This is evidenced by the fact that Project Developers sometimes pay for used devices, as opposed to waste collection, where the waste generator has to pay for waste treatment.

* In this case, some environmental [impacts from the device’s first life should be allocated to the refurbished device](#user-content-fn-10)[^10]. It is assumed that **only devices that undergo light refurbishment were in good condition and had residual value,** and are allocated a share of GHG emissions from the device’s first life. On the other hand, devices that undergo full refurbishment are assumed to be non-functional waste and are not allocated any environmental impacts from their first life.
* The residual value and corresponding **allocated emissions are based on the ratio of the buyback price to the selling price of a new manufactured device**. An average ratio shall be used for each device type, and is shown in Table 4. Alternatively, Project Developers may provide a similar project-specific database with their own buyback data.

{% hint style="info" %}
**For example**, if Smartphone A has an average buyback price of 100€, and it is sold new for 400€, its residual value is 25% of its original value. Then when it undergoes light refurbishment by the project, it is modeled as an input with 25% of its initial production impacts.

If production of a new Smartphone A emits 80 kgCO<sub>2</sub>eq, and it has a residual value of 25%, then the calculations shall include it as an input with 20 kgCO<sub>2</sub>eq.
{% endhint %}

*Table 4 Residual value of device types. See* [*Appendix 7*](/methodologies/refurbishing-of-electronic-devices/appendix.md#oi5bmdhs49zb) *for more details for smartphone, iPhone, tablet, and iPad. The average value of these device types was applied to the remaining device types due to a lack of device-specific buyback data.*

| Device               | Percent of residual value |
| -------------------- | ------------------------- |
| Smartphone           | 11%                       |
| iPhone               | 14%                       |
| Tablet               | 20%                       |
| iPad                 | 12%                       |
| Laptop               | 14%                       |
| Macbook              | 14%                       |
| PC                   | 14%                       |
| iMac                 | 14%                       |
| Gaming console       | 14%                       |
| Monitor (both sizes) | 14%                       |

**Secondary transport of devices:** After the device is collected by the refurbishing project and sorted, it may be sent to a different refurbishment site, for example to do specialty repairs. Project Developers shall report such secondary transport by providing the distance transported, and the number and type of devices making this transport.

<details>

<summary><strong>Calculation refurbishing process</strong></summary>

This step calculates the GHG emissions from the refurbishing process $$(Total\ E\_{P.refurbishing\ process})$$ broken down into four main processes: 1) light refurbishing impacts, 2) full refurbishing impacts, 3) residual value of input devices, and 4) secondary transport of devices.

$$\textbf{(Eq.6)}\ N\_{light\ ref.i}\ = \sum(N\_{i.collected}\*R{ef}\_{light.i})$$

where,

* $$N\_{light\ ref.i}$$ represents the number of devices of type $$i$$ undergoing the light refurbishing process and sold in a functional state.
* $$N\_{i.collected}$$ is calculated in the section [#calculations-project-e-waste-collection](#calculations-project-e-waste-collection "mention")
* $$R{ef}\_{light.i}$$ represents the fraction of devices of type $$i$$ undergoing the light refurbishing process and sold in a functional state.

$$\begin{aligned}\textbf{(Eq.7)}\ E\_{light\ ref} = \sum N\_{light\ ref.i}\ *(\ \&alcohol*EF\_{\ alcohol}\ +\ \&paper\ *EF\_{paper}\ +\ \&cloth*EF\_{cloth}\ +\ \&electricity\*EF\_{national\ grid\ electricity})\end{aligned}$$

where,

* $$E\_{light\ ref}$$ represents the sum of GHG emissions due to the light refurbishing of a device type.
* $$N\_{light\ ref.i}$$is calculated in Equation 6.
* *alcohol*, *paper, cloth* and *electricity* represent the amount of cleaning alcohol, paper and cloth needed to clean a device. These amounts were taken per device type from the [ADEME study](#user-content-fn-4)[^4], pages 45, 77, and 103.
* $$EF\_{\ alcohol}$$ represents the emission factor, in kgCO$$\_2$$eq, for cleaning alcohol composed of 70% ethylene and 30% water. Refer to [Appendix 1](/methodologies/refurbishing-of-electronic-devices/appendix.md#jfq1kp34xji7) for the ecoinvent process used.
* $$EF\_{paper}$$ represents the emission factor, in kgCO$$\_2$$eq, of paper. Refer to [Appendix 1](/methodologies/refurbishing-of-electronic-devices/appendix.md#jfq1kp34xji7) for the ecoinvent process used.
* $$EF\_{cloth}$$ represents the emission factor, in kgCO$$\_2$$eq, of cloth used for cleaning. Refer to [Appendix 1](/methodologies/refurbishing-of-electronic-devices/appendix.md#jfq1kp34xji7) for the ecoinvent process used.
* $$EF\_{national\ grid\ electricity}$$ represents the emission factor, in kgCO$$\_2$$eq, of electricity in the national grid where the project is located, used for software and functionality testing. Refer to [Appendix 1](/methodologies/refurbishing-of-electronic-devices/appendix.md#jfq1kp34xji7) for the ecoinvent process used.

$$\textbf{(Eq.8)}\ N\_{full\ ref.i}\ = \sum(N\_{i.collected}\*R{ef}\_{full.i})$$

where,

* $$N\_{full\ ref.i}$$ represents the number of devices of type $$i$$ undergoing the full refurbishing process and sold in a functional state.
* $$N\_{i.collected}$$ is described in the section [#calculations-project-e-waste-collection](#calculations-project-e-waste-collection "mention").
* $$R{ef}\_{full.i}$$ represents the fraction of devices of type $$i$$ undergoing the full refurbishing process and sold in a functional state.

$$\textbf{(Eq.9)}\ E\_{full\ ref} = \sum N\_{full\ ref.i}\ \*R\_{full\ ref.i}\*EF\_{full\ ref}$$

where,

* $$E\_{full\ \ ref}$$ represents the sum of GHG emissions due to the full refurbishing of a device type.
* $$N\_{full\ ref.i}$$is calculated in Equation 8.
* $$R\_{full\ ref.i}$$ represents the rate of full refurbishment activities modeled per device type *i*. This reflects the "amount" of refurbishment used as an input for that device. See [Appendix 3](/methodologies/refurbishing-of-electronic-devices/appendix.md#id-21d91pp0841i) for its calculation and the amounts.
* $$EF\_{full\ ref}$$ represents the emission factor, in kgCO$$\_2$$eq, of one full refurbishment activity. This activity includes a mix of ecoinvent processes, described in [Appendix 1](/methodologies/refurbishing-of-electronic-devices/appendix.md#jfq1kp34xji7) and section [#refurbishing-process](#refurbishing-process "mention").

$$\textbf{(Eq.10)}\ E\_{residual} = \sum N\_{light\ ref.i}\ \* \frac{Av.acquisition\_{price.i}}{Av.selling\_{price.i}} \* EF\_{new\ i}$$

where,

* $$E\_{residual}$$ represents the sum of residual GHG emissions from the device's first life allocated to the refurbished device, for all devices.
* $$N\_{light\ ref.i}$$ is calculated in Equation 6.
* $$Av.acquisition\_{price.i}$$represents the average price paid for the collected used devices of type *i* (also called the buyback price)*.*
* $$Av.selling\_{price.i}$$represents the average selling price of a new device of type $$i$$.
* $${{EF}*{new\.i}}*{\ }$$ represents the emission factor in kgCO$$\_2$$eq/kg due to the production of the new device type $$i$$. The emission factors of new devices are presented in Table 3.

$$\begin{aligned}\textbf{(Eq.11)}\ E\_{secondary\ transport} = \sum&(N\_{secondary\ transport,i}\*W\_{i}*D\_{secondary\ transport})\ &*\ EF\_{\ truck\ transport}\end{aligned}$$

where,

* $$E\_{secondary\ transport}$$ represents the sum of GHG emissions from secondary transport.
* $$N\_{secondary\ transport,i}$$ is the number of devices of device type $$i$$ that are sent for secondary transport.
* $$W\_{i}$$ and $$\ EF\_{\ truck\ transport}$$ are described in the [#calculations-project-e-waste-treatment](#calculations-project-e-waste-treatment "mention").
* $$D\_{secondary\ transport}$$ represents the distance traveled for secondary device transport in km per device type $$i$$.

$$\begin{aligned}\textbf{(Eq.12)}\ Total\ E\_{P.refurbishing\ process} = \ \&E\_{light\ ref} + {\ E}*{full\ ref}\ + &{\ E}*{residual} + E\_{secondary\ transport}\end{aligned}$$

where,

* $$Total\ E\_{P.refurbishing\ process}$$represents the sum of GHG emissions in the project scenario refurbishing process LCA step, in kgCO$$\_2$$eq.

</details>

## Baseline scenario <a href="#luws2req6grv" id="luws2req6grv"></a>

<figure><img src="/files/IxxT8PP5wCrvEjMCwff2" alt=""><figcaption><p><em>Figure 2 The system boundary and scope of the baseline scenario are shown. They are broken down into three life cycle stages, each described in the corresponding sections below</em></p></figcaption></figure>

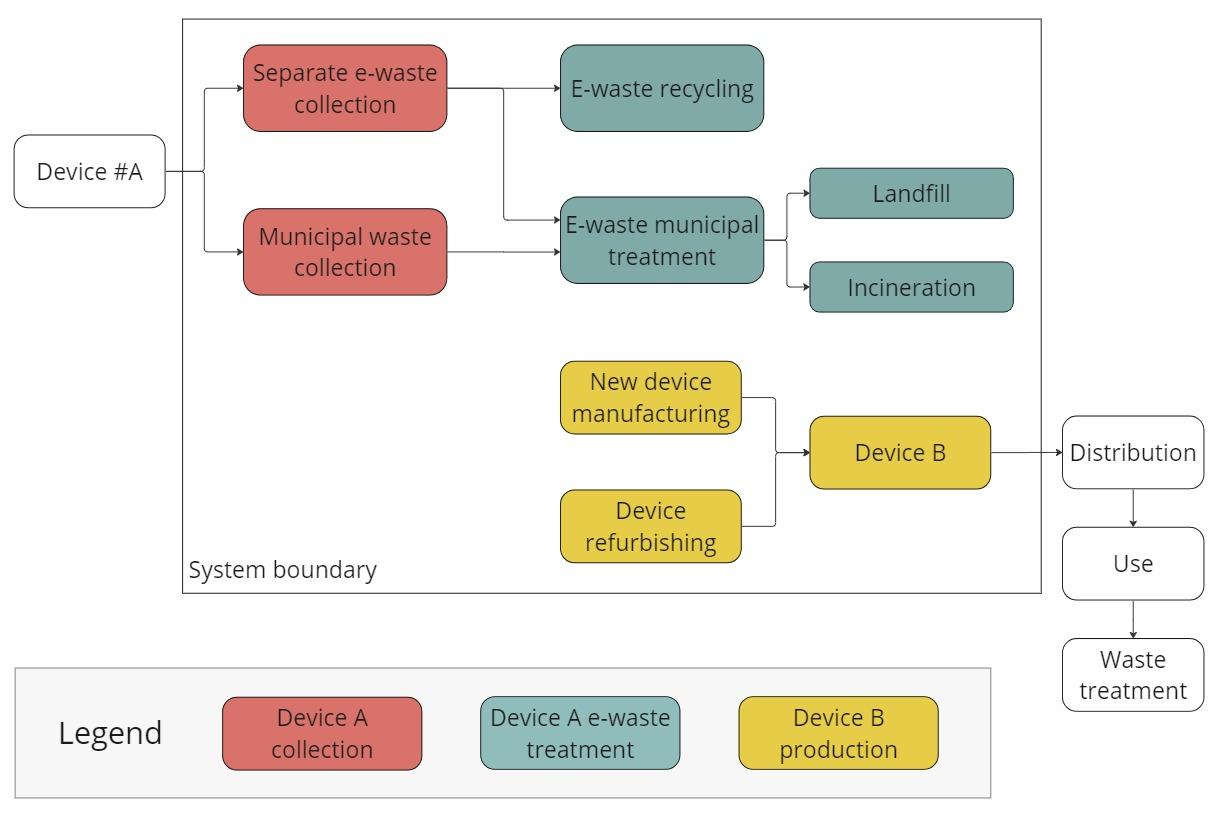
The baseline scenario consists of two main functions: **1) waste treatment of the device after its first life** (Device A) and **2) provisioning of a new device** (Device B). The system boundary of the baseline scenario is shown in Figure 2. This is broken down into 3 life cycle stages, which are detailed in the following sections:

* Device A collection
* Device A e-waste treatment
* Manufacturing of Device B

The baseline scenario **structure** remains valid for the entire crediting period but may be significantly revised earlier if:

* The Project Developer notifies Rainbow of a substantial change in project operations or baseline conditions, and/or
* The methodology is revised, affecting the baseline scenario.

The **specific values** within the baseline scenario will be updated during each crediting period, using project data to accurately reflect the equivalent of the project’s operations.

The structure of the baseline scenario is the same whether the project consists of ongoing operations or an expansion. In the former, project data from **all annual site operations** is considered, and the baseline scenario is defined as the functional equivalent of all annual operations. For an expansion project, **only project data related to the expansion is considered**, because the normal annual operations would be the same in the baseline and project scenario, and can therefore be excluded.

{% hint style="info" %}
**For example**, for an expansion project, if the expansion allows for the refurbishment of an extra 5,000 devices annually in addition to the business-as-usual (BAU) 10,000 devices, then the baseline scenario could include the BAU refurbishment of 10,000 devices plus the new manufacturing of 5,000 devices. The same BAU refurbishment of 10,000 devices could also be included in the project scenario.

The processes related to the BAU refurbishment are then excluded from the GHG reduction quantification of both the project and baseline scenarios since they would have no effect on the avoided emissions. The remaining project activity to consider is the refurbishment of the extra 5,000 devices from the expansion project.
{% endhint %}

### E-waste collection

It is assumed that e-waste is transported by truck 100 km to its waste treatment center.

The mass of e-waste collected in the baseline scenario equals the **total mass of input used devices** collected by the refurbishing project annually.

Total mass of devices shall be calculated using the number of devices collected for each device type (provided by the Project Developer), multiplied by the assumed mass of each device type shown in Table 3.

Project Developers may provide more precise information on the mass of collected devices if it is available.

<details>

<summary><strong>Calculations baseline e-waste collection</strong></summary>

This step calculates the GHG emissions from the baseline e-waste collection life cycle stage ($${Total\ E}\_{B.collection}$$).

$$\textbf{(Eq.13)}\ Total\ E\_{B.collection} = \sum(N\_{i.\ collected}\*W\_{i}\ )\*D\ \*\ EF\_{truck\ transport}$$

where,

* $$Total$$ $$E\_{B.collection\ }$$ represents the sum of GHG emissions in kgCO$$\_2$$eq due to the transport of devices.
* $$N\_{i.\ collected}$$ is calculated in Equation 1.
* $$W\_{i}$$ is described in Equation 2.
* $$D$$ represents the distance of the device collection in kilometers, which is assumed to be 100 km.
* $$\ EF\_{truck\ transport}$$ represents the emission factor of truck transport in kgCO$$\_2$$eq/kg.km. Refer to [Appendix 1](/methodologies/refurbishing-of-electronic-devices/appendix.md#jfq1kp34xji7) for the ecoinvent process used.

</details>

### E-waste treatment

The treatment of e-waste is split between recycling, landfilling and incineration (Figure 2).

The proportion of e-waste recycled is based on national statistics obtained from the Eurostat database for small IT devices, as defined by the WEEE directive. Data for other countries where used devices are frequently sourced are taken from the [UN Global E-waste Monitor](#user-content-fn-11)[^11], and extrapolated where necessary. The dataset and more detailed information are in [Appendix 4](/methodologies/refurbishing-of-electronic-devices/appendix.md#id-3kg7rf7e4jf).

**First, the fraction of e-waste that is not separately collected** is assumed to be collected with municipal waste and incinerated or landfilled. In 2021, for example, this was an average of [31% ](#user-content-fn-12)[^12]for the countries included in Eurostat.

The repartition between landfilling and incineration (with and without energy recovery) was taken from Eurostat, and the total repartition for all EU countries from 2020 was used. This resulted in [52% incineration and 48% landfilling](#user-content-fn-13)[^13].

**Then, the fraction of e-waste that is separately collected** is considered (average of [69% in the EU in 2021](#user-content-fn-14)[^14]).

* This can be further broken down into the fraction successfully recycled/reused [(average of 79% for EU countries in 2021)](#user-content-fn-12)[^12] and the fraction that could not be recycled/reused (21%). Country specific fractions are used and are presented in [Appendix 4](#id-3kg7rf7e4jf).
* The separately collected e-waste that could not be recycled/reused is assumed to be incinerated and landfilled, with the same proportions described in the Baseline scenario section [#e-waste-treatment](#e-waste-treatment "mention").

<details>

<summary><strong>Calculation baseline e-waste treatment</strong></summary>

This step calculates the GHG emissions from the baseline e-waste treatment life cycle stage ($$Total\ E\_{B.\ waste\ treatment}$$).

$$\begin{aligned}\textbf{(Eq.14)}\ E\_{B.waste} = \sum\ &(N\_{i.\ collected}*W\_{i}\ *(1 - {RR\_{rate. i}}\_{}))\\*&(L\_{rate}*\ EF\_{landfill} + I\_{rate}\*{EF}\_{incineration})\end{aligned}$$

where,

* $$E\_{B.waste\ }$$ represents the sum of GHG emissions due to the **e-waste treatment of devices not separately collected**.
* $$N\_{i.\ collected}$$ and $$\ W\_{i}$$ are described in the section [#calculations-baseline-e-waste-collection](#calculations-baseline-e-waste-collection "mention").
* $$W\_{i}$$ is described in Equation 2.
* $${RR}\_{rate}$$ represents the project's country waste reuse and recycling rate. These rates are presented in [Appendix 1](/methodologies/refurbishing-of-electronic-devices/appendix.md#jfq1kp34xji7).
* $$L\_{rate}$$ and $$I\_{rate}$$ represent the landfilling and incineration rates, respectively, described in section [#e-waste-treatment](#e-waste-treatment "mention").
* $$EF\_{landfill}$$ represents the emission factor of treating e-waste via landfill, in kgCO$$\_2$$eq/kg using ecoinvent database, according to the breakdown of materials on pg. 11 of the [ADEME study](#user-content-fn-4)[^4]:
  * treatment of waste plastic, mixture, sanitary landfill = 50%
  * treatment of waste glass, sanitary landfill = 10%
  * treatment of waste aluminum, sanitary landfill = 40%
* $$EF\_{incineration}$$ represents the emission factor of treating e-waste via incineration, in kgCO$$\_2$$eq/kg using ecoinvent database according to the following split :
  * treatment of waste glass, municipal incineration = 10%
  * treatment of waste plastic, consumer electronics, municipal incineration = 50%
  * treatment of scrap copper, municipal incineration = 20%
  * treatment of scrap aluminum, municipal incineration = 20%

$$\textbf{(Eq.15)}\ E\_{B.separate\ waste} = \sum(N\_{i.\ collected}*W\_{.i}*{RR\_{rate.i}}*{}\*\ EF*{recycling.i}$$*)*

where,

* $$E\_{B.separate\ waste}$$ represents the sum of GHG emissions due to the e-waste treatment of **separately collected devices**.
* $$N\_{i.\ collected}$$ ,$$\ W\_{i\ }$$, and $${RR}\_{rate}$$ are describe above.
* $$EF\_{\ recycling.i}$$ represents the emission factor of recycling device *i*, in kgCO$$\_2$$eq/kg. Refer to [Appendix 1](/methodologies/refurbishing-of-electronic-devices/appendix.md#jfq1kp34xji7) for the ecoinvent process implemented.

$$\textbf{(Eq.16)}\ Total\ E\_{B.\ waste\ treatment} = E\_{B.waste} + {E\_{B.separate\ waste}}$$

where,

* $$Total\ E\_{B.\ waste\ treatment}$$represents the sum of GHG emissions in the baseline scenario e-waste treatment life cycle stage, in kgCO$$\_2$$eq.

</details>

### New device production <a href="#aq9a8bw7wcjk" id="aq9a8bw7wcjk"></a>

The number of new devices to consider in the baseline scenario corresponds to the number of devices successfully refurbished and sold in a functional state in the project scenario. Note that this does not necessarily equal the number of used devices collected, because a fraction of devices can not be successfully refurbished.

To quantify avoided GHG emissions, the **baseline scenario must consider the market share of the project technology already in use**. Currently, new device purchases come from both new manufacturing and existing refurbishing activities, and this is reflected in the baseline scenario (see Figure 2). The proportions of new and refurbished devices are detailed in Table 5.

{% hint style="info" %}
For example, in 2022, 87% of smartphones sold in Europe were new, while 13% were refurbished (Table 5). Thus, each smartphone refurbished by the project is assumed to replace the manufacturing of 0.87 new devices.
{% endhint %}

*Table 5 Market share of refurbished devices sold annually in Europe. See* [*Appendix 6*](/methodologies/refurbishing-of-electronic-devices/appendix.md#id-5lf32r1yzlvs) *for more details.*

| Device            | Percent Refurbished | Percent new |
| ----------------- | ------------------- | ----------- |
| Smartphone/iPhone | 13%                 | 87%         |
| Tablet/iPad       | 7%                  | 93%         |
| Laptop/Macbook    | 8%                  | 92%         |
| PC/iMac           | 8%                  | 92%         |
| Gaming console    | 6%                  | 94%         |
| Monitor           | 6%                  | 94%         |

The process of manufacturing a new device is taken from the ecoinvent database: laptop, PC, tablet, and monitor (See [Appendix 1](/methodologies/refurbishing-of-electronic-devices/appendix.md#jfq1kp34xji7)).

GHG emissions from manufacturing Apple devices (iPhones, iPads, iMacs, and Macbooks) are taken from the production-stage impacts reported in Apple’s Product Environmental Reports. An average emission factor for recent models of devices was taken, and the emission factors considered are presented in [Appendix 2](/methodologies/refurbishing-of-electronic-devices/appendix.md#nnoq7cm16r60).

The emission factor for smartphones was based on ecoinvent data and adjusted to better represent average smartphones. This was necessary because

1. smartphones are one of the most frequently refurbished devices, so special attention should be paid to them
2. [smartphone emission factors are notoriously variable](#user-content-fn-15)[^15], and
3. it has been noted that [ecoinvent smartphone emission factors are underestimated](#user-content-fn-16)[^16]. See [Appendix 5](/methodologies/refurbishing-of-electronic-devices/appendix.md#oqs0gfvs1gpx) for full details.

The difference in lifetime between refurbished and new devices, described in the [Baseline Scope](/methodologies/refurbishing-of-electronic-devices/eligible-technologies.md#baseline-scope) section, is accounted for in this life cycle stage. **The amount of new device production avoided in the baseline scenario is proportional to the ratio of new and refurbished device lifetimes**.

{% hint style="info" %}
Note that this ratio is only applied to the new manufacturing of devices, as shown in Table 5, and not applied to avoided refurbished devices in the baseline scenario.
{% endhint %}

The impacts of refurbishing devices are described in the Refurbishing process section above.

<details>

<summary><strong>Calculation new device production</strong></summary>

This step calculates the GHG emissions from the baseline device production life cycle stage ($$Total\ E\_{B.\ new\ device\ production\ \ }$$).

$$\textbf{(Eq.17)}\ E\_{new\.device} = \sum(\ N\_{i.\ sold}\*{frac}*{New}\*EF*{new\.i})$$

where,

* $${E\_{new\.device}}\_{\ }$$ represents the sum of GHG emissions in kgCO$$\_2$$eq due to the **production of new devices** (i.e. excluding the market share of refurbished devices that are already in use).
* $$N\_{i.\ sold\ }$$ was described in Equation 1.
* $${frac}\_{New}$$ refers to the market share (in percentage) of new devices sold annually per device type *i*, as presented in Table 1.
* $${{EF}*{new\.i}}*{\ }$$ represents the emission factor in kgCO$$\_2$$eq/kg due to the production of the new device type *i*. The emission factors of new devices are presented in Table 3.

$$\textbf{(Eq.18)}\ E\_{Ref\ B} = \sum(\ N\_{i.\ sold}\*frac\_{Refurb}\*R\_{full\ ref.i}\*EF\_{full\ ref})$$

where,

* $$E\_{Ref\ B}$$ represents the sum of GHG emissions due to the **refurbishing of used devices** according to the market shares in the baseline scenario.
* $$N\_{i.\ sold\ }$$ was described in Equation 1.
* $${frac}\_{Refurb}$$ refers to the market share (in percentage) of refurbished devices sold annually per device type *i*, as presented in Table 5.
* $$R\_{full\ ref.i}$$ and $$EF\_{full\ ref}$$ are described in Equation 9.

Refurbished devices are assumed to have a shorter lifespan than new devices, as described in the [Baseline Scope](/methodologies/refurbishing-of-electronic-devices/eligible-technologies.md#baseline-scope) section. This is accounted for in the following adjustment to avoided emissions from new device manufacturing:

$$\textbf{(Eq.19)}\ E\_{new\ device\ lifetime\ adjusted} = \sum(E\_{new\ device\ .i}\*\ Y\_{refurbished.i}/Y\_{new\.i})$$

where,

* $${Y\_{refurbished.i}}\_{\ }$$ represents the expected lifespan of a refurbished device *i* in number of years, as presented in Table 3.
* $$Y\_{new\.i}$$ represents the expected lifespan of a new device *i* in number of years, as presented in Table 3.

The total GHG emission for this life cycle stage are calculated according to the following equation:

$$\textbf{(Eq.20)}\ Total\ E\_{B.\ new\ device\ production} = E\_{Ref} + E\_{new\ device\ lifetime\ adjusted}$$

where,

* $$\ Total\ E\_{B.\ new\ device\ production\ \ }$$represents the sum of GHG emissions in the baseline scenario new device production life cycle stage, in kgCO$$\_2$$eq.

</details>

## Avoided GHG emissions

Avoided GHG emissions are calculated by subtracting the sum of the project scenario GHG emissions from the sum of the baseline GHG scenario emissions.

<details>

<summary><strong>Comparative GHG assessment calculation</strong></summary>

The total baseline GHG emissions, total project GHG emissions, and the project's avoided emissions are calculated as follows.

$$\begin{aligned}\textbf{(Eq.21)}\ Project\ emissions\ = \ \&Total\ E\_{P.collection} \\+ \ \&Total\ E\_{P.waste\ treatment} \\+\ \&Total\ E\_{P.refurbishing\ process}\end{aligned}$$

$$\begin{aligned}\textbf{(Eq.22)}\ Baseline\ emissions = \ &{Total\ E}*{B.collection} \\+ \&Total\ E*{B.\ waste\ treatment} \\+ &{Total\ E}\_{B.\ new\ device\ production\ \ }\end{aligned}$$

$$\textbf{(Eq.\ 23)}\ Avoided\ emissions\ = \ Baseline\ emissions\ - \ Project\ emissions$$

</details>

## Uncertainty assessment

An uncertainty assessment is presented below for all aspects of GHG quantification set **at the methodology level**. The findings from this assessment are then applied **at the project level**, where project-specific GHG quantification also undergoes an uncertainty assessment.

The **overall project GHG quantification uncertainty** is determined by qualitatively combining both the methodology-level and project-specific uncertainties for each identified source of uncertainty.

The [assumptions](#assumptions) that are estimated to have **high uncertainty** (i.e. high variability and high impact) are:

* The amount of devices avoided in the baseline scenario is proportional to the ratio of new and refurbished device **lifetimes**.
* The ratio of new and refurbished device GHG emissions from ADEME can be extrapolated to represent the refurbishing process of all similar devices.
* The residual economic value of used devices represents the GHG emissions that should be allocated from production Device A first life to the refurbished Device B.

The [assumptions](#assumptions) that are estimated to have **moderate uncertainty** are:

* **Similar devices have similar characteristics** (mass, emission factor, lifetime), leading to grouping devices into device type categories rather than assessing specific device models and brands.
* The distribution of Device B in the baseline and project scenarios is assumed to be the same.

The [assumptions](#assumptions) that are estimated to have **low uncertainty** (i.e. low variability and low impact) are:

* Non-functioning parts are assumed to be recycled.
* The distance for e-waste collection of Device A in the baseline scenario is assumed to be 100 km.
* Packaging, use, and waste treatment of Device B are assumed to be the same in the baseline and project scenarios.
* Monitors with no size breakdown are assumed to be <25". This assumption is conservative, as smaller monitors are associated with lower impacts from new device production, resulting in reduced avoided emissions.

The baseline scenario selection has **low uncertainty** and is mostly standardized. It accounts for project-specific information regarding the number, type and fate of devices, and national e-waste management statistics.

The equations used in this methodology consist of basic conversions and have **low uncertainty**.

Many estimates and secondary data are used in this methodology to enable a reasonable amount of project data collection. These data have varying levels of uncertainty, and are assessed in Table 6.

The uncertainty at the methodology level is estimated to be moderate. This translates to an **expected discount factor of at least 10%** for projects under this methodology.

*Table 6 Presentation of all secondary data and estimates used, and an assessment of their uncertainty.*

<table><thead><tr><th width="141">Parameter</th><th width="128">Reference in document</th><th>Uncertainty assessment</th></tr></thead><tbody><tr><td>Emissions new device (kgCO<sub>2</sub>eq)</td><td>Table 3</td><td><p>For Apple devices, an average emission factor for new device production was taken from recent models, and the data samples are presented in <a href="/pages/NBUhyXPRACrQfq8Pp3If#nnoq7cm16r60">Appendix 2</a>. There is low uncertainty in the data samples, since the LCAs come from the manufacturer for the specific model. There is moderate uncertainty related to the distribution of these values, where the different devices have coefficients of variation (standard deviation/mean) of 6-36%.</p><p>For smartphones, the emission factor from ecoinvent has been thoroughly researched and modified to better represent average modern smartphones. Still, there is large variability in smartphone design, and there is high uncertainty in this one representative value.</p><p>Other devices come from ecoinvent processes and similar to smartphones, have variable designs, so there is high uncertainty in using one representative value.</p></td></tr><tr><td>Impact of refurbished (%)</td><td>Table 3</td><td>This percentage comes from the detailed <a href="https://librairie.ademe.fr/ged/7385/ademe_impact_environnemental_reconditionnement_rapport_en.pdf">ADEME refurbishing LCA</a>. That study uses high quality primary data so the values themselves have low uncertainty.</td></tr><tr><td>Average mass (kg)</td><td>Table 3</td><td>The same analysis can be applied from “Emissions new device (kgCO<sub>2</sub>eq)”. However this parameter has a smaller impact on the avoided GHG emissions calculations, so the uncertainty can be considered lower.</td></tr><tr><td>Lifetime new and refurbished (years)</td><td>Table 3</td><td>These values come from the detailed <a href="https://librairie.ademe.fr/ged/7385/ademe_impact_environnemental_reconditionnement_rapport_en.pdf">ADEME refurbishing LCA</a> and are well within the range of expected lifetimes found elsewhere in the literature. Nonetheless, these estimates have a large impact on the results and are expected to have moderate uncertainty.</td></tr><tr><td>Market share refurbished vs new (percent)</td><td>Table 5</td><td>This secondary data is highly influential and is estimated to have low uncertainty for smartphones, where precise data were available for many countries. For other device types, there is moderate uncertainty.</td></tr><tr><td>Residual value of input devices</td><td>Table 4, <a href="#oi5bmdhs49zb">Appendix 7</a></td><td>This measurement comes from device buyback prices and new device prices. For smartphones and tablets, there is low uncertainty here because buyback data came directly from Project Developers, and a large and representative sample of new device prices was taken. For other device types, the lack of buyback price data leads to moderate uncertainty.</td></tr><tr><td>WEEE statistics</td><td><a href="#id-3kg7rf7e4jf">Appendix 4</a></td><td>These values have moderate uncertainty because they come from macro-level national datasets.</td></tr></tbody></table>

[^1]: ISO 14064-2:2019. Greenhouse gases — Part 2: Specification with guidance at the project level for quantification, monitoring and reporting of greenhouse gas emission reductions or removal enhancements.

[^2]: Wernet, G., Bauer, C., Steubing, B., Reinhard, J., Moreno-Ruiz, E., Weidema, B., 2016. The ecoinvent database version 3 (part I): overview and methodology. Int J Life Cycle Assess 21, 1218–1230. <https://doi.org/10.1007/s11367-016-1087-8> ↑

[^3]: [Eurostat 2023](https://ec.europa.eu/eurostat/statistics-explained/index.php?title=International_trade_and_production_of_high-tech_products#Manufacturing_of_high-tech_products), International trade and production of high-tech products. Accessed April 2024.

[^4]: Fangeat Erwann, ADEME, Laurent Eskenzai, Eric Fourboul, Hubblo, Julie Orgelet-Delmas,

    DDemain, Etienne Lees Perasso, Firmin Domon, LCIE Bureau Veritas. 2022. [Assessment of the environmental impact of a set of refurbished products – Final report](https://librairie.ademe.fr/ged/7385/ademe_impact_environnemental_reconditionnement_rapport_en.pdf). 180 pages.

[^5]: Refer to Appendix 1 for the ecoinvent processes used for non-Apple devices, to Appendix 5 for the modifications made to the ecoinvent smartphone production process, and to Appendix 2 for Apple emission factor sources.

[^6]: Based on the[ ADEME study](https://librairie.ademe.fr/ged/7385/ademe_impact_environnemental_reconditionnement_rapport_en.pdf) ratio of GHG emissions of new vs. refurbished devices emissions, described in paragraph 3.4.7. Refer to Appendix 3.

[^7]: Based on the [ADEME study](https://librairie.ademe.fr/ged/7385/ademe_impact_environnemental_reconditionnement_rapport_en.pdf) for smartphone, laptop, PC and tablet. Apple products' weights are presented in Appendix 3.

[^8]: [ADEME study](https://librairie.ademe.fr/ged/7385/ademe_impact_environnemental_reconditionnement_rapport_en.pdf), Table 2, pg 27.

[^9]: Kouloumpis, V., Konstantzos, G.E., Chroni, C., Abeliotis, K. and Lasaridi, K. (2023). Does the circularity end justify the means? A life cycle assessment of preparing waste electrical and electronic equipment for reuse. Sustainable Production and Consumption, \[online] 41, pp.291–304. doi:<https://doi.org/10.1016/j.spc.2023.08.008>.

[^10]: Pamminger, R., Glaser, S., Wimmer, W., 2021. Modelling of different circular end-of-use scenarios for smartphones. Int J Life Cycle Assess 26, 470–482. <https://doi.org/10.1007/s11367-021-01869-2>

[^11]: Cornelis P. Baldé, Ruediger Kuehr, Tales Yamamoto, Rosie McDonald, Elena D’Angelo, Shahana Althaf, Garam Bel, Otmar Deubzer, Elena Fernandez-Cubillo, Vanessa Forti, Vanessa Gray, Sunil Herat, Shunichi Honda, Giulia Iattoni, Deepali S. Khetriwal, Vittoria Luda di Cortemiglia, Yuliya Lobuntsova, Innocent Nnorom, Noémie Pralat, Michelle Wagner (2024). International Telecommunication Union (ITU) and United Nations Institute for Training and Research (UNITAR). 2024. [Global E-waste Monitor 2024](https://ewastemonitor.info/wp-content/uploads/2024/03/GEM_2024_18-03_web_page_per_page_web.pdf). Geneva/Bonn.

[^12]: Eurostat 2023. Waste electrical and electronic equipment (WEEE) by waste management operations - open scope, 6 product categories (from 2018 onwards). DOI: <https://doi.org/10.2908/ENV_WASELEEOS>. Accessed April 2024.

[^13]: Eurostat 2023. Management of waste excluding major mineral waste, by waste management operations. DOI: <https://doi.org/10.2908/ENV_WASOPER>. Accessed April 2024.

[^14]: Eurostat 2023. Waste electrical and electronic equipment (WEEE) by waste management operations - open scope, 6 product categories (from 2018 onwards). DOI: <https://doi.org/10.2908/ENV_WASELEEOS>. Accessed April 2024.

    \\

[^15]: Clément, L.-P.P.-V. .P., Jacquemotte, Q.E.S. and Hilty, L.M. (2020). Sources of variation in life cycle assessments of smartphones and tablet computers. *Environmental Impact Assessment Review*, 84, p.106416. doi:<https://doi.org/10.1016/j.eiar.2020.106416>.

[^16]: Smartphones’ carbon footprints are largely underestimated. (2023). *Le Monde.fr*. \[online] 16 Apr. Available at: <https://www.lemonde.fr/en/pixels/article/2023/04/16/smartphones-carbon-footprints-are-largely-underestimated\\_6023093\\_13.html>.


---

# Agent Instructions: Querying This Documentation

If you need additional information that is not directly available in this page, you can query the documentation dynamically by asking a question.

Perform an HTTP GET request on the current page URL with the `ask` query parameter:

```
GET https://docs.rainbowstandard.io/methodologies/refurbishing-of-electronic-devices/ghg-reduction-quantification.md?ask=<question>
```

The question should be specific, self-contained, and written in natural language.
The response will contain a direct answer to the question and relevant excerpts and sources from the documentation.

Use this mechanism when the answer is not explicitly present in the current page, you need clarification or additional context, or you want to retrieve related documentation sections.
