> For the complete documentation index, see [llms.txt](https://docs.rainbowstandard.io/llms.txt). Markdown versions of documentation pages are available by appending `.md` to page URLs; this page is available as [Markdown](https://docs.rainbowstandard.io/~/changes/140/methodologies/biomass-carbon-removal-and-storage-bicrs/carbon-storage/marine-sub-sediment-burial.md).

# Marine sub-sediment burial

V1.0

| **Module name**      | Sub-sediment burial                        |
| -------------------- | ------------------------------------------ |
| **Module category**  | Carbon storage                             |
| **Methodology nam**e | Biomass carbon removal and storage (BiCRS) |
| **Version**          | 1.0                                        |
| **Methodology ID**   | RIV-BICRS-CS-MSSB-V1.0                     |
| **Release date**     | <mark style="color:red;">July 2025</mark>  |
| **Status**           | In use                                     |

{% content-ref url="/pages/D1bECpowUAiJorSGzbQY" %}
[Glossary](https://docs.rainbowstandard.io/~/changes/140/glossary.md)
{% endcontent-ref %}

<details>

<summary>Acknowledgements <span data-gb-custom-inline data-tag="emoji" data-code="1f91d">🤝</span></summary>

This module was developed by Riverse with support from [Sinkco Labs](https://www.sinkcolabs.com/), particularly their science team, and Brenna Boehman, PhD, who provided fundamental scientific knowledge on storage in sub-sediment anoxic conditions. We extend our gratitude to [EcoEngineers ](https://www.ecoengineers.us/)and [David Harning, PhD](https://www.colorado.edu/instaar/david-harning), for their expert review. Riverse sincerely appreciates the valuable contributions of all involved in this work.

</details>

This is a **Carbon Storage Module** and covers Marine sub-sediment burial. This module is part of the Riverse BiCRS methodology, which allows Project Developers to choose the relevant modules for their project, and shall be used with the necessary accompanying modules.

See more details on how modules are organized in the [BiCRS home page](https://docs.rainbowstandard.io/~/changes/140/methodologies/biomass-carbon-removal-and-storage-bicrs.md#efpqng3v3ute).

<table data-view="cards" data-full-width="false"><thead><tr><th></th><th></th><th></th><th data-hidden data-card-target data-type="content-ref"></th><th data-hidden data-card-cover data-type="files"></th></tr></thead><tbody><tr><td><strong>How to use this module</strong></td><td></td><td></td><td><a href="https://docs.rainbowstandard.io/~/changes/140/methodologies/biomass-carbon-removal-and-storage-bicrs.md#efpqng3v3ute">Biomass carbon removal and storage (BiCRS)</a></td><td><a href="https://1461901304-files.gitbook.io/~/files/v0/b/gitbook-x-prod.appspot.com/o/spaces%2FE1FUJsBoIj20nqp3CtMf%2Fuploads%2FWRAnXQMFNSn97t9GOrFx%2Fpexels-eberhardgross-1612461.jpg?alt=media&amp;token=2c97e54f-1b97-4eb7-aead-e423aea08c21">pexels-eberhardgross-1612461.jpg</a></td></tr><tr><td><strong>BiCRS Methodology</strong></td><td></td><td></td><td><a href="https://docs.rainbowstandard.io/~/changes/140/methodologies/biomass-carbon-removal-and-storage-bicrs.md">Biomass carbon removal and storage (BiCRS)</a></td><td><a href="https://1461901304-files.gitbook.io/~/files/v0/b/gitbook-x-prod.appspot.com/o/spaces%2FE1FUJsBoIj20nqp3CtMf%2Fuploads%2FxCzQ8uZc1ZueBLAkCHsc%2FBiochar%20Powder%20Close-up.webp?alt=media&amp;token=8d17efe7-f9d2-4035-bf0a-91fc6c1ae553">BiCRS methodology.webp</a></td></tr></tbody></table>

## Eligible technologies

#### Project type <a href="#uikucys7r1rk" id="uikucys7r1rk"></a>

This module covers marine sub-sediment burial projects that inject waste and residual biomass feedstock inputs directly into the [**anoxic** ](#user-content-fn-1)[^1]layer of [marine sub-sediments](#user-content-fn-2)[^2]. Projects shall meet all of the following criteria:

* Demonstrate capability to perform MRV as agreed upon in the validated project documentation
* Demonstrate a net-negative project carbon footprint based on initial LCA estimates of induced emissions and initial CDR estimates based on modeling
* Projects that **sink** biomass to the seafloor but do not bury and embed it into marine sub-sediments are **not eligible**.
* The entity eligible for receiving carbon finance is the operator performing storage at the sub-sediment burial site. Biomass producers and sub-sediment burial machinery manufacturers are not eligible Project Developers.

#### Project scope <a href="#gs84uiswpg2k" id="gs84uiswpg2k"></a>

A project is defined as **all burial activities that take place from one port** over the project lifetime (by default a maximum of 5 years, [renewable](https://docs.rainbowstandard.io/~/changes/140/rainbow-standard-documents/procedures-manual/project-certification-procedure.md#crediting-period-renewal)), and all removal that occurs as a result of that burial, plus the upstream/downstream activities associated with that burial (e.g. GHG emissions from feedstock sourcing, transport...).

See the [Storage batch](#ad7rimjzuv5e) section for more details on how a project is organized into different burial areas and burial events.

#### Eligible sites <a href="#aih0rwwz5szx" id="aih0rwwz5szx"></a>

Storage must be done in [**anoxic** ](#user-content-fn-1)[^1]conditions.

Storage must be done in **existing accessible** [**marine sub-sediment**](#user-content-fn-2)[^2]. Projects that excavate, dredge or build wells for the sole purpose of accessing sub-sediments or creating sub-sediment conditions are not eligible, due to the associated environmental risks.

See the [Site characterization](#id-9yt6lk62t36) section for more specific requirements.

#### Eligible feedstock <a href="#ja1qpxfjotc" id="ja1qpxfjotc"></a>

Only [particulate terrestrial biomass](#user-content-fn-3)[^3] feedstock that also meets the requirements of the[ BiCRS Biomass Feedstock module](https://docs.rainbowstandard.io/~/changes/140/methodologies/biomass-carbon-removal-and-storage-bicrs/carbon-capture/biomass-feedstock.md) is eligible in this module. Injection of liquefied or gaseous CO$$\_2$$ into sediments is outside the scope of this module.

See the [BiCRS Biomass Feedstock module](https://docs.rainbowstandard.io/~/changes/140/methodologies/biomass-carbon-removal-and-storage-bicrs/carbon-capture/biomass-feedstock.md) for more specific feedstock requirements.

## Crediting timeline and process <a href="#vqih1nxeqk4n" id="vqih1nxeqk4n"></a>

{% stepper %}
{% step %}

### Pre-project sampling

Before or in parallel to validation with Riverse, the Project Developer shall obtain the necessary permits, and take measurements and samples, and gather secondary sources, for the [Site Characterization Report](#id-9yt6lk62t36-1) and feedstock characterization, and propose a [sampling plan](#aklb6qbc2jek).&#x20;
{% endstep %}

{% step %}

### Project validation

The Project Developer submits required documentation and undergoes an ex-ante validation audit. The project documentation is made available on the registry, expected CDR volume is estimated, and [provisional credits](broken://pages/Y3iSwVnSj0qR6798Ser3#credit-pools) are available for pre-purchase agreements. Specific prerequisites include:

* [Permissions ](#o97hd5b4ge3i)have been granted to operate at the storage site, and to monitor the site up to 12-months after storage.
* The storage points are technically appropriate and can allow for permanent carbon storage. This is proven by generating the [Site Characterization Report](#id-9yt6lk62t36-1), demonstrating adherence to all requirements in the [Storage site requirements](#id-9yt6lk62t36-1) section.
* The biomass feedstock has been secured and a preliminary assessment of organic carbon content has been made.
* Expected CDR is modeled using [validation-stage estimates equations](#k1tsrh5yuegy).&#x20;
  {% endstep %}

{% step %}

### Burial events

Feedstock mix is buried in the predefined storage points, and monitored at the storage site and storage batch level.

Visual proof of each burial event and site closure is required, via imagery documented in the PDD and subsequent Monitoring Reports, to confirm that the site is well-sealed by surrounding sediments or other surface enhancements (e.g. rocks/rubble, clay caps) and confirm closure.
{% endstep %}

{% step %}

### (Optional) Monitoring: first measurement and CDR verification

Between 1-3 months after burial, Project Developers conduct first monitoring by following the [Monitoring Plan](#snhouoxhyrzi) and the [Sampling Plan](#aklb6qbc2jek) to measure organic carbon content in buried biomass for each storage batch. Additional storage points may be added within the validated storage sites. CDR estimates and permanence are [updated with verified real data](#bpf7f2gx9dj5).

Project Developers may choose to either use:

* **50/50 issuance:** undergo a verification audit by a VVB at the first measurement step and issue the first 50% of removal RCCs on the Riverse registry. Repeat the audit after the following step (Step 5) to issue the remaining 50%, or&#x20;
* **One-time issuance:** skip the first measurement and verification step, and wait to issue 100% of removal RCCs at the second measurement stage described below (Step 5).
  {% endstep %}

{% step %}

### Monitoring: second measurement and CDR verification

Project Developers conduct the second monitoring at least 12 months after burial, following the [Monitoring Plan](#snhouoxhyrzi) and the [Sampling Plan](#aklb6qbc2jek), to measure organic carbon content in buried biomass for each storage batch. CDR estimates and permanence are [updated with verified real data](#bpf7f2gx9dj5), and verified by the VVB.

* **50/50 issuance:** the remaining credits are issued. Any discrepancies in earlier results, for example as a result of degradation, shall be accounted for by updating CDR calculations and following the [over/under crediting mechanism](https://docs.rainbowstandard.io/~/changes/140/rainbow-standard-documents/procedures-manual/rcc-management-avoiding-over-crediting.md#under-overachievement) in the Riverse Procedures Manual.
* **One-time issuance:** all credits are issued for that storage batch based on the 12-month measurements.
  {% endstep %}

{% step %}

### Ongoing project operations

Steps 3 through 5 are repeated throughout the 5-year project crediting period for as many storage batches as the Project Developer completes.&#x20;
{% endstep %}

{% step %}

### End of project

Monitoring and verification continues for a maximum of 5 years until the end of the crediting period.
{% endstep %}

{% step %}

### Renew the crediting period

The Project Developer may choose to [renew the project's crediting period](https://docs.rainbowstandard.io/~/changes/140/rainbow-standard-documents/procedures-manual/project-certification-procedure.md#crediting-period-renewal) to extend the monitoring plan and continue repeating steps 3 through 5.
{% endstep %}
{% endstepper %}

## Storage batches <a href="#ad7rimjzuv5e" id="ad7rimjzuv5e"></a>

Measurements and reporting are performed for **storage batches**. Verification and credit issuance is done at the reporting period scale (by default, annually), and groups results for all storage batches concerned during that reporting period. The organization of a project into **storage batches**, **sites** and **points** is described below, and depicted in Figure 1.

<table data-view="cards"><thead><tr><th></th></tr></thead><tbody><tr><td>A <strong>storage batch</strong> is all burial events of homogenous feedstock mixtures at one storage site over a maximum of 31 days.</td></tr><tr><td>A <strong>storage site</strong> is a group of similar storage points within 24 km<span class="math">^2</span> of one another with similar site characteristics.</td></tr><tr><td>A <strong>storage point</strong> is the precise spot where a burial event occurs. Similar storage points may be grouped into a storage site.</td></tr></tbody></table>

<figure><img src="https://1461901304-files.gitbook.io/~/files/v0/b/gitbook-x-prod.appspot.com/o/spaces%2FE1FUJsBoIj20nqp3CtMf%2Fuploads%2Fn79BB33ec2pTAM3XT8Rh%2FClimate%20team%20-%20Schemes%20-%20Frame%205%20(1).jpg?alt=media&amp;token=1a28a2de-eb69-47c6-a57a-d10a8e401263" alt=""><figcaption><p>Figure 1 This figure illustrates how a project is organized into storage batches, storage sites, and storage points. Storage Batch #1 and Storage Batch #2 differ because Storage Batch #1 exceeded the 31-day limit and rolled over into a new batch. Storage Batch #1 and Storage Batch #3 occur over the same dates but are stored at different sites under distinct conditions. Meanwhile, Storage Batch #3 and Storage Batch #4 represent a shift in feedstock mixture, which defines a new storage batch, even though the previous batch did not reach the full 31-day duration.</p></figcaption></figure>

Sedimentary conditions for storage points within one storage site must be within the following ranges (data requirements are outlined in the [Data Sources](#g6ohrisnjsbj) section):

* **Grain size:** the majority grain size at the burial sediment depth must be either defined as either clay (0.002-0.05 mm) or sand (0.05-2 mm) for all storage points within a storage site, indicated by >50% of sediment grain size. Defined by recommendations of USGS[^4].
* **Water depth** at storage point: At water depths 1-20 m, water depths must be within 0.5 m. At water depths 20-200 m, water depths must be within 5 m.
* **Sub-sediment depth** of storage: At sub-sediment depths 2-3 m, storage depths must be within 0.5 m. At sub-sediment depths >3 m, storage depths must be within 1 m.

Ongoing burial into the sub-sediment shall last no longer than [**31 days per storage batch**](#user-content-fn-5)[^5], to standardize sampling timescales. If burial continues after 31 days, it shall be considered a separate storage batch.

One project may work with different storage batches simultaneously. **Each storage batch shall be monitored and reported separately** within the same Monitoring Report. Storage batch information shall be monitored and reported at least once per calendar year.

Information about storage batches may be monitored and [**issued credits continuously**](https://docs.rainbowstandard.io/~/changes/140/rainbow-standard-documents/procedures-manual/project-certification-procedure.md#continuous-issuance) by Project Developers by uploading claim information to the Riverse MRV platform.

## Feedstock mixture <a href="#id-9yt6lk62t36" id="id-9yt6lk62t36"></a>

A feedstock mixture is defined as one biomass feedstock or uniform mixtures of feedstocks. One feedstock mixture may be used across several storage batches, but any time the feedstock mixture of one storage batch changes, a new storage batch shall be started.

Any water used in the feedstock mixture must come from within the 24 km$$^2$$ storage batch area.

The feedstock mixture composition may vary by no more than 20% to be considered the same homogeneous feedstock mixture, where the composition is made of feedstocks of a specific type from a specific supplier.&#x20;

See the [Pre-burial sampling](#pre-burial-sampling) section for requirements on feedstock sampling.

{% hint style="info" %}
For example, if a feedstock mixture is composed of 50% sawdust and 50% shredded straw, the proportions can vary between 40% and 60% (±10% of the original 50% for both inputs).

If a feedstock mixture is composed of 50% sawdust from Supplier A and and 50% from Supplier B, the proportions can vary between 40% and 60% (±10% of the original 50% for both inputs).
{% endhint %}

## Storage site and storage point requirements <a href="#id-9yt6lk62t36" id="id-9yt6lk62t36"></a>

Storage points must meet the criteria outlined in Table 1 to be eligible. The criteria are set to ensure storage points are suitable for permanent carbon storage, are anoxic, and have low reversal risks.&#x20;

All criteria shall be outlined in the **Site Characterization Report**, prepared before any burial events occur and submitted with the PDD for the validation audit. In addition, the Site Characterization Report shall provide GPS coordinates of each planned storage point, and a GIS-generated map showing each storage point and the delineation of the associated storage site.

{% hint style="info" %}
Additional storage sites and points may be proposed after project operations begin and credits are issued, provided no burial occurs at the new sites or points before they are validated. To add new storage sites and points, the Project Developer must update the Site Characterization Report with the required details. A VVB shall audit the report to ensure compliance with requirements in Table 1. Once approved, the new sites and points must adhere to the monitoring plan requirements.
{% endhint %}

Data sources characterizing storage points must be, in the following order of preference

1. primary data from a pilot survey e.g. site surveys, in situ measurements and measurements on samples collected at the project site, delivered by the Project Developer, or&#x20;
2. secondary data from the specific area concerned (e.g. published peer-reviewed literature or database measurements) or&#x20;
3. secondary data from an area that is proven to be sufficiently representative and similar to the project area in the appropriate factors that relate to permanent storage.

*Table 1 The required measurements and information for a storage site that must be presented in the Site Characterization Report, before any burial occurs, to justify that the storage site is appropriate for permanent CDR via marine sub-sediment burial.*&#x20;

<table><thead><tr><th width="162">Criteria</th><th>Description</th></tr></thead><tbody><tr><td><strong>Marine water</strong></td><td>Must be in coastal, sea or ocean waters with a salinity greater than zero. Freshwater burial is not currently eligible. </td></tr><tr><td><strong>Anoxic Sediment Layer</strong></td><td><p>Must reach deep enough into the sub-sediment to reach the <a data-footnote-ref href="#user-content-fn-2">anoxic zone</a>. This shall be <strong>at least 2 m into the sediment</strong> (see <a href="#dg5ezfux812d">Appendix </a>C for justification), but actual depth to achieve this varies by site and shall be justified for each project. </p><p>The depth must remain anoxic year-round, accounting for bioturbation or increased advection/diffusion into sediments. The sub-sediment area must be stable with low likelihood of re-exposure, proven via established tools for determining sediment stability such as 210Pb or other geochronology tools.</p></td></tr><tr><td><strong>Water depth</strong></td><td>Must ensure the surface of the water bottom (seafloor or sediment surface) is not exposed to the air during tidal fluctuations.</td></tr><tr><td><strong>Methane diffusion</strong></td><td>Methane must not be diffusing out of the sediment-water interface. This is measured using <a data-footnote-ref href="#user-content-fn-6">oxygen penetration depth</a> as a proxy for methane diffusion. This requirement is to ensure that if any buried feedstock mixture degrades, it would not be emitted as the stronger GHG methane, and would instead  be emitted as CO<span class="math">_2</span>. In any case, loss of organic carbon from the biomass would be detected.</td></tr><tr><td><strong>Potential gas exchange</strong></td><td><p>Project Developers shall use all criteria mentioned above to calculate potential gas exchange from embedded depth into the atmosphere, to justify that there will be minimal gas exchange of any evolved gases with the atmosphere during a 1000 year period. </p><p>This requirement ensures that if any buried feedstock mixture degrades, the CO<span class="math">_2</span> generated will likely remain trapped in the sediment and remain stored, rather than <a data-footnote-ref href="#user-content-fn-7">diffusing </a>through the water column into the atmosphere.</p></td></tr><tr><td><strong>Shelf slope</strong></td><td>Sediment or seafloor gradation must be &#x3C;1:100 to prevent sediment <a data-footnote-ref href="#user-content-fn-8">slumping</a>.</td></tr><tr><td><strong>Sediment grain size</strong></td><td>At the target sub-sediment depth, grain size must be at minimum 50% of at maximum 2 mm particle size.</td></tr><tr><td><strong>Authorization and access</strong></td><td>Project Developers must be authorized by jurisdictional authorities to operate, perform burial events and complete monitoring at the given geographic coordinates.</td></tr><tr><td><strong>Potential for Future Disturbance</strong></td><td>This shall be qualitatively and transparently discussed in the Site Characterization Report to determine if sediment disturbance may occur in the next 40 years, due to deep-sea mining, oil and gas extraction, trawling from fishing vessels, other resource exploitation, or any other use-conflict that might lead to reversal of storage. The site lease agreement should implement suitable barriers to such disturbance events.</td></tr><tr><td><strong>Marine life</strong></td><td>Characterize the biodiversity of marine life at the storage site, considering species type and abundance. This is used to 1) identify any sensitive biodiversity hotspots and 2) as a benchmark to compare identify any environmental damages after post-burial. Jurisdictional permitting and Environmental Impact Assessment procedures should already cover this, so this is implemented as an abundance of caution. </td></tr></tbody></table>

## Sampling requirements <a href="#aklb6qbc2jek" id="aklb6qbc2jek"></a>

Sampling occurs at two stages of the project: sampling of the feedstock mixture before burial to establish organic carbon buried, and sampling the feedstock mixture after burial to check for any reversals (i.e. carbon degradation or diffusion. At both stages of sampling, laboratory testing shall provide the following measurements of the feedstock mixture:

* % organic carbon content of the solid biomass
* % moisture content of the feedstock mixture
* density of the feedstock mixture

### **Pre-burial sampling**

Two representative samples of the feedstock mixture shall be prepared and sent for laboratory testing per storage batch: one at the beginning (day one) and one at the end of the storage batch (day 31 or an earlier date when the storage batch is complete).&#x20;

### **Post-burial monitoring and sampling**

Post-burial monitoring and sampling shall occur:

* at least 12 months after the burial event, and&#x20;
* optionally, may also be performed within 1-3 months after the burial event if the Project Developer chooses the 50/50 credit issuance approach. See the [Crediting timeline and process ](#vqih1nxeqk4n)section for more details.&#x20;

Post-burial monitoring and sampling should be completed using sediment coring, to access the buried biomass, extract samples, and send them to a laboratory to measure the organic content of the solid biomass. Alternative approaches may be considered on a case by case basis, and approved by the VVB, the Riverse Certification team and, if deemed necessary by the Riverse Certification team, an expert peer reviewer.

**Sampling and laboratory testing shall be done separately for each storage point**. At least three sub-samples shall be taken from each storage point and mixed together to obtain one composite sample for the storage point. Samples can not be mixed from all storage points in one storage site to perform laboratory tests on a composite sample.

### Sampling plan

Project Developers shall prepare an **ex-ante** **Sampling Plan** before any burial events occur, and submit it with the PDD for the validation audit. The Sampling Plan shall describe:&#x20;

* how representative samples will be taken of the feedstock mixture in pre-burial sampling
* how to preserve moisture content of feedstock mixture while sending it to the lab
* number of samples used for post-burial sampling
* strategy for ensuring random/representative/unbiased sampling locations for post-burial sampling

### **Sampling procedure**

The Sampling Plan described above is developed ex-ante during validation and outlines the *intended* sampling approach. During monitoring and ex-post verification, Project Developers must provide a **Sampling Procedure**, described in the [Monitoring Report](https://docs.rainbowstandard.io/~/changes/140/rainbow-standard-documents/procedures-manual/project-certification-procedure.md#monitoring-plan), which documents the actual sampling approach that was implemented.

Ideally, the Sampling Procedure should align exactly with the Sampling Plan. However, given real-world challenges that may arise during monitoring, deviations are expected. The purpose of documenting the Sampling Procedure ex-post is to ensure transparency by capturing any adjustments made to the original plan.

The **Sampling Procedure shall include all elements listed in the Sampling Plan components** section.

## Eligibility criteria <a href="#id-8818d1p2uq2v" id="id-8818d1p2uq2v"></a>

The eligibility criteria requirements specific to this module are detailed in the sections below. Other eligibility criteria requirements shall be taken from the accompanying modules and methodologies:&#x20;

<table data-view="cards"><thead><tr><th></th><th></th><th></th><th data-hidden data-card-target data-type="content-ref"></th><th data-hidden data-card-cover data-type="files"></th></tr></thead><tbody><tr><td><strong>BiCRS methodology</strong></td><td><ul><li>Additionality</li><li>No double counting</li><li>Targets alignment</li><li>ESDNH</li></ul></td><td></td><td><a href="https://docs.rainbowstandard.io/~/changes/140/methodologies/biomass-carbon-removal-and-storage-bicrs.md">Biomass carbon removal and storage (BiCRS)</a></td><td><a href="https://1461901304-files.gitbook.io/~/files/v0/b/gitbook-x-prod.appspot.com/o/spaces%2FE1FUJsBoIj20nqp3CtMf%2Fuploads%2FxCzQ8uZc1ZueBLAkCHsc%2FBiochar%20Powder%20Close-up.webp?alt=media&amp;token=8d17efe7-f9d2-4035-bf0a-91fc6c1ae553">BiCRS methodology.webp</a></td></tr><tr><td><strong>Other modules</strong></td><td><ul><li>Substitution</li><li>Co-benefits</li><li>No double counting</li><li>ESDNH</li><li>Leakage</li></ul></td><td></td><td><a href="https://docs.rainbowstandard.io/~/changes/140/methodologies/biomass-carbon-removal-and-storage-bicrs/carbon-storage.md">Carbon storage modules</a></td><td><a href="https://1461901304-files.gitbook.io/~/files/v0/b/gitbook-x-prod.appspot.com/o/spaces%2FE1FUJsBoIj20nqp3CtMf%2Fuploads%2FF1IanyzrKsw31BYTsPoH%2Ffre-sonneveld-q6n8nIrDQHE-unsplash.jpg?alt=media&amp;token=208fac4c-8056-41fd-b7c3-1bb14c9e20a2">energy co products module.jpg</a></td></tr><tr><td><strong>Riverse Standard Rules</strong></td><td><ul><li>Measurability</li><li>Real</li><li>TRL</li><li>Minimum impact</li></ul></td><td></td><td><a href="broken://pages/gTMkXybrVIPpNkeGjEj8">Broken link</a></td><td><a href="https://1461901304-files.gitbook.io/~/files/v0/b/gitbook-x-prod.appspot.com/o/spaces%2FE1FUJsBoIj20nqp3CtMf%2Fuploads%2FZfVDsA9FYXpuDXs9f5Le%2FMONOGRAMME_RIVERSE_MULTICOLOR.jpg?alt=media&amp;token=4b84b929-53be-4bd9-9ffc-ea18e280d7e4">Riverse R.jpg</a></td></tr></tbody></table>

### Permanence <a href="#id-6mhy92a80ym0" id="id-6mhy92a80ym0"></a>

Removal Riverse Carbon Credits (RCCs) issued from marine sub-sediment burial have a permanence horizon of 1000 years.

Permanence is assessed at two points during project certification:&#x20;

* at ex-ante validation it is **estimated using literature data and models**
* during verification it is **demonstrated using direct measurements**.&#x20;

Requirements for each stage are detailed below.

#### Estimating permanence at validation <a href="#k1tsrh5yuegy" id="k1tsrh5yuegy"></a>

To demonstrate that carbon in sub-sediment burial will remain permanently stable, indicators from the [Storage site and storage point requirements ](#id-9yt6lk62t36-1)section must be provided at validation, in the Site Characterization Report, demonstrating compliance with the requirements.

These indicators are **suitable proof that a substantial fraction** of the buried carbon is permanently stable. The amount of permanently stored carbon is determined using the models and equations detailed in the [GHG reduction quantification](#uua77odyg1lf) section.

#### Demonstrating permanence at verification <a href="#bpf7f2gx9dj5" id="bpf7f2gx9dj5"></a>

At verification, it is assumed that **92% of organic carbon still remaining in the feedstock mixture 12 months after burial will remain permanently stored over 1000 years**. This is based on modeled results for oxic marine sediments, and likely overestimate the non-permanent fraction of organic carbon in anoxic marine sediments, as required under this module.&#x20;

For each storage batch, the organic carbon content in the buried feedstock mixture is measured via sampling, and observed via remote sensing, at 1-3 months (optional) and 12 months (mandatory) to determine the carbon permanently stored.

The actual amount of permanently stored carbon is measured as described in the [GHG quantification section](#uua77odyg1lf), replacing the modeled amounts used during validation to issue ex-post Riverse Carbon Credits.

{% hint style="warning" %}
If measured organic carbon loss, at 3 or 12 months, exceeds 2% of the initially buried carbon, degradation may be triggered. In this case, the project is considered compromised, and carbon credit issuance for the affected storage batches will be paused. The Riverse Certification team will collaborate with Project Developers to determine the cause of the unexpected loss and decide on appropriate corrective actions, including canceling issued credits according to the [Rainbow Procedures Manual](https://docs.rainbowstandard.io/~/changes/140/rainbow-standard-documents/procedures-manual/rcc-management-avoiding-over-crediting.md#cancelation).
{% endhint %}

#### Risk of reversal <a href="#ufd5h5pvzv82" id="ufd5h5pvzv82"></a>

Project Developers shall fill in the Riverse Marine sub-sediment burial [risk evaluation](#risk-evaluation-template) to **evaluate the risk of carbon storage reversal**, based on social, economic, natural, and delivery risks.

Project Developers shall assign a likelihood and severity score to each risk, and provide an explanation of their choices. The Riverse Certification team shall evaluate the assessment and may recommend changes to the assigned scores.

The Project Developer, Riverse Certification team, or the third-party auditor may suggest additional risks to be considered for a specific project.

Each reversal risk with a **high or very risk score** is subject to:

* **risk mitigation plan**, developed by the Project Developer, that details the long-term strategies and investments for preventing, monitoring, reporting and compensating carbon removal reversal, or
* **additional contributions to the buffer pool**, at a rate of 3% of verified removal Riverse Carbon Credits for each high or very high risk

All projects under this module are estimated to have a material reversal risk, due to&#x20;

* risk of degradation from improper burial in oxic conditions
* risk of physical leakage from burial sites
* the novelty of the technology, meaning the abovementioned points have not been proven as consistent and reliable.

Therefore, the risk mitigation plan includes adhering to all site characteristics, plus a reversal monitoring requirement. At least 5 years after burial, Project Developers shall

* at a subset of storage sites, measure remaining organic carbon in feedstock samples
* at all storage sites, confirm the presence and extent of buried feedstock using radar

### Co-benefits <a href="#jrm3oypynw1w" id="jrm3oypynw1w"></a>

Project Developers shall prove that their project provides **at least 2 co-benefits** from the [UN Sustainable Development Goals](https://unstats.un.org/sdgs/indicators/Global-Indicator-Framework-after-2024-refinement-English.pdf) (SDGs) framework (and no more than 4).

Common co-benefits of Marine sub-sediment burial projects, and their sources of proof, are detailed in Table 2. Project Developers may suggest and prove other co-benefits not mentioned here.

*Table 2 Summary of common co-benefits provided by Marine sub-sediment burial projects. Co-benefits are organized under the United Nation Sustainable Development Goals (UN SDGs) framework.*

<table><thead><tr><th width="158">UN SDG</th><th width="292">Example</th><th>Proof</th></tr></thead><tbody><tr><td><p><strong>SDG 9</strong>: Industry,</p><p>innovation, and</p><p>infrastructure</p></td><td>The use of offshore technology, such as oil and gas exploration and exploitation equipment, retrofitting maritime vessels to use for more sustainable application than fossil fuel extraction and merchant transport.</td><td>Project Developers standard operating procedure (SOP) for the disposal and burial of biomass feedstock.</td></tr><tr><td><strong>SDG 14</strong>: Aquatic life</td><td>Project Developers can develop long-term ecological monitoring stations to support monitoring of sub-sediment burial and support regional monitoring for ocean health indicators.</td><td>Project Developers demonstrate  collaborations with regional universities or governmental institutions for collaborative long-term monitoring, and measurements to be completed. Relevant data should be open source.</td></tr></tbody></table>

### Environmental and social do no harm <a href="#amkr8oso802r" id="amkr8oso802r"></a>

Project Developers shall prove that the project does not contribute to substantial environmental and social harms.

Projects must follow all national, local, and European (if located in Europe) environmental regulations related to the project activities.

Feedstock sustainability risks shall be taken from the [Biomass feedstock module](https://docs.rainbowstandard.io/~/changes/140/methodologies/biomass-carbon-removal-and-storage-bicrs/carbon-capture/biomass-feedstock.md).

#### ESDNH risk evaluation

Project Developers shall fill in the Riverse Marine sub-sediment burial [risk evaluation](#risk-evaluation-template) to evaluate the identified environmental and social risks of Marine sub-sediment burial projects. The identified risks include:&#x20;

* Release of biomass via improper embedding
* Release of aqueous CO$$\_2$$ or methane at sediment-water interface
* Release of hydrogen sulfide at oxic-anoxic transition zone
* Project activities impacting benthic life
* Transfer of harmful pollutants in biomass feedstock
* Marine pollution due to ship time spent over storage site

Project Developers shall assign a likelihood and severity score of each risk, and provide an explanation of their choices. The VVB and Rainbow’s Certification team shall evaluate the assessment and may recommend changes to the assigned scores.

All risks with a high or very high risk score are subject to a [Risk Mitigation Plan](https://docs.rainbowstandard.io/~/changes/140/rainbow-standard-documents/rainbow-standard-rules/general-eligibility-criteria.md#risk-mitigation-plan), which outlines how Project Developers will mitigate, monitor, report, and if necessary, compensate for any environmental and/or social harms.

Additional proof may be required for certain high risk environmental and social problems.

The Project Developer, the Rainbow Certification Team, or the VVB may suggest additional risks to be considered for a specific project.

{% hint style="info" %}
Note that the **life-cycle GHG reduction calculations account for the climate change impacts of most environmental risks**. Nonetheless, Project Developers shall transparently describe any identified GHG emission risks in the risk evaluation template.
{% endhint %}

{% hint style="info" %}
All risk assessments must also address the [Minimum ESDNH risks ](https://docs.rainbowstandard.io/~/changes/140/rainbow-standard-documents/rainbow-standard-rules/general-eligibility-criteria.md#minimum-esdnh-risks-to-assess)defined in the Rainbow Standard Rules.
{% endhint %}

#### Permitting <a href="#o97hd5b4ge3i" id="o97hd5b4ge3i"></a>

Project Developers must follow all relevant laws and legal requirements for reporting operations to local, federal and international governing bodies. Project Developers must follow the requirements outlined in their permit relating to the amount of tonnes injected if specified, and geographic area permitted for operations.

Permits are typically required for accessing coastal marine sediments and performing sub-sediment burial. The Project Developer must provide written authorization by either 1) the permit granting regulatory authority or 2) by the partner providing the permit demonstrating freedom to operate and perform sub-sediment burial in the geographic area defined in the PDD.

#### Environmental Impacts Assessment (EIA) <a href="#bcjgj9hknk0a" id="bcjgj9hknk0a"></a>

Typically, the EIA should be completed in advance of obtaining permitting for credit generation, and will be completed over the course of operations and reported to Riverse.

EIA may not be required for all permits for storage. When EIA is not required for permitting (e.g. for a research permit or permit exemption), the Project Developer shall demonstrate that a baseline environmental survey has been completed, assessing the elements listed below, and that the potential impacts have been considered to be within regulatory guidelines. This justification shall be evaluated by both the VVB and the Riverse Certification Team. Project Developers shall provide the same information as they would in a full EIA to Riverse for project validation, and cover aspects including:

* Marine protected areas
* Benthic habitat
* Fishing grounds
* Shipping lanes
* Subsea infrastructure
* Materials of historical significance

Baseline environmental survey and/or EIA must address how the project adheres to regulatory requirements such as limitations on sediment resuspension and habitat destruction due to seabed intervention.

## GHG quantification <a href="#uua77odyg1lf" id="uua77odyg1lf"></a>

<figure><img src="https://1461901304-files.gitbook.io/~/files/v0/b/gitbook-x-prod.appspot.com/o/spaces%2FE1FUJsBoIj20nqp3CtMf%2Fuploads%2F9QIniAeZiFIUGhsCZS33%2FClimate%20team%20-%20Schemes%20-%20sub%20sediment%20storage%20process%20(2).jpg?alt=media&amp;token=b68cbf20-7253-4641-9f70-33b7787169e7" alt=""><figcaption><p>Figure 2 An example of the project process and possible operations, highlighting the Riverse BiCRS modules that correspond to each process: biomass feedstock, transport, infrastructure and machinery, processing and energy use, and the present module marine sub-sediment burial. </p></figcaption></figure>

The system boundary of this quantification section starts after burial of feedstock mixture and covers carbon storage through end of life after 1000 years, and accounts for potential re-emission and decay modeled for 1000+ years. Sources of GHG emissions covered in this module include only permanent carbon storage modeling. Other GHG emissions shall be taken from the accompanying modules.

{% hint style="info" %}
There is no baseline from this module because it is assumed that there is no significant share of the project activity already occurring in business-as-usual. Therefore, the baseline for removal credits is zero and is omitted from calculations.

According to the Riverse Procedures Manual, this assumption shall be re-assessed at a [minimum every 3 years](https://docs.riverse.io/riverse-standard-documents/procedures-manual/documentation-and-methodologies-management#revising-a-methodology) during the mandatory methodology revision process, and any changes to this assumption would be [applied to existing projects](https://docs.riverse.io/riverse-standard-documents/procedures-manual/project-certification-procedure#compliance-and-project-updates).

Note that baseline scenario carbon sequestration or leakage impacts may be included for the project from the [biomass feedstock module](https://docs.riverse.io/methodologies/biomass-carbon-removal-and-storage-bicrs/carbon-capture/biomass-feedstock#ghg-quantification).
{% endhint %}

### Data sources <a href="#g6ohrisnjsbj" id="g6ohrisnjsbj"></a>

The required **primary data** for GHG reduction calculations from projects are presented in Table 3. These data shall be included in the project’s PDD and made publicly available.

*Table 3 Summary of primary data needed from projects and their source for project validation and verification. See the* [*Monitoring Plan* ](#snhouoxhyrzi)*section for more details on monitoring and verification requirements. Asterisks (\*) indicate which data shall be updated for each storage batch.*&#x20;

<table><thead><tr><th width="183">Parameter</th><th width="125">Unit</th><th>Source proof</th></tr></thead><tbody><tr><td>Sediment grain size</td><td>mm</td><td><ul><li>primary data from a pilot survey of the site</li><li>secondary data from the specific area concerned (e.g. published peer-reviewed literature or database measurements)</li><li>secondary data from an area that is proven to be sufficiently representative and similar to the project area in the appropriate factors that relate to permanent storage</li><li>reported in the <a href="#id-9yt6lk62t36-1">Site Characterization Report</a></li></ul></td></tr><tr><td>Sub-sediment depth (X)</td><td>m</td><td>Same as above</td></tr><tr><td>Volume of feedstock mixture buried per storage batch*</td><td>m<span class="math">^3</span></td><td>Equipment logs on machinery delivering the burial</td></tr><tr><td>Organic carbon content of feedstock mixture *</td><td>% organic carbon</td><td><ul><li>Laboratory testing of <a href="#aklb6qbc2jek">feedstock mixture samples</a></li><li>Measured per storage batch, <a href="#pre-burial-sampling">2x pre-burial</a> and <a href="#post-burial-monitoring-and-sampling">1-2x post-burial</a> (1-3 months, and 12 months)</li><li>Reported in the Feedstock Characterization Report for each storage batch</li></ul></td></tr><tr><td>Moisture content of feedstock mixture*</td><td>fraction</td><td>Same as above</td></tr><tr><td>Density of feedstock mixture*</td><td>kg/m<span class="math">^3</span></td><td>Same as above</td></tr></tbody></table>

**Secondary data** taken from the literature are used to define default values for the parameters outlined in Table 4. These values are only used for ex-ante validation models, and will be replaced by project measurements during verification.

If project incubation experiments or *in situ* experiments are used to provide values for $$G$$ and $$k$$parameters, these experiments must either 1) be scientifically peer reviewed and published in academic journals, or 2) undergo independent external peer review for the specific project.

*Table 4 Values from scientific literature that may be used instead of primary data, for validation stage ex-ante carbon degradation modeling.*&#x20;

<table data-full-width="false"><thead><tr><th width="169">Parameter</th><th width="152">Variable</th><th>Source proof</th></tr></thead><tbody><tr><td>Fractional pools of complex organic carbon</td><td><span class="math">G_{int,1,0},\ G_{int,2,0}</span> and <span class="math">G_{res,0}</span> </td><td><p>Project Developers may choose between three sources for these values:</p><ul><li><a data-footnote-ref href="#user-content-fn-9">literature </a>(oxic biomass bale sinking experiment, values are 0.012, 0.091, 0.897 for each <span class="math">G</span> variable, respectively).</li><li>project incubation experiments with the feedstock mixture in representative marine sub-sediments.</li><li><em>in situ</em> experiments with the biomass feedstock mixture in representative marine sediments.</li></ul></td></tr><tr><td>Rate constants</td><td><p></p><p><span class="math">k_{int1},\ k_{int2}</span> and <span class="math">k_{res}</span> </p></td><td><p>Same options as above.</p><p><a data-footnote-ref href="#user-content-fn-9">Literature </a>values are 0.04, 0.002, and 0 for each <span class="math">k</span> variable, respectively </p></td></tr></tbody></table>

### Carbon storage modeling <a href="#cxpdobk03o90" id="cxpdobk03o90"></a>

**Carbon storage** is calculated by subtracting the amount of organic carbon degraded over 1000 years from the amount of initially buried organic carbon.&#x20;

* **Carbon burial** is measured using the amount of feedstock mixture buried, and its measured organic carbon content.&#x20;
* **Carbon degradation** is subtracted from this carbon burial. It is [modeled at validation](#k1tsrh5yuegy) and [measured at verification](#bpf7f2gx9dj5).

<details>

<summary>Calculations: Carbon storage modeling</summary>

$$\textbf{(Eq.1)}\ R\_{P,\ Storage}=C\_{buried}-C\_{loss}$$

Where

* $$R\_{P,\ Storage}$$ represents the total carbon removed in the present [Carbon Storage](https://docs.rainbowstandard.io/~/changes/140/methodologies/biomass-carbon-removal-and-storage-bicrs/carbon-storage.md) module on marine sub-sediment burial. It is used in Eq. 1 in the [Removals Calculations](https://docs.rainbowstandard.io/~/changes/140/methodologies/biomass-carbon-removal-and-storage-bicrs/bicrs-methodology.md#calculations-removals) section of the [BiCRS methodology](https://docs.rainbowstandard.io/~/changes/140/methodologies/biomass-carbon-removal-and-storage-bicrs/bicrs-methodology.md). It is calculated for each storage batch.
* $$C\_{buried}$$ represents the tonnes of CO$$\_2$$eq in the buried feedstock mixture, calculated below in Eq. 2.
* $$C\_{loss}$$ represents the tonnes of CO$$\_2$$eq in the buried feedstock mixture that are degraded, lost and re-emitted, and is calculated in Eq. 3.

$$\textbf{(Eq.2)}\ C\_{buried}=V\_{feedstock}\times \rho\_{feedstock} \times (1-M\_%) \times C\_{org,\ feedstock} \times C\ to\ CO\_2$$

Where

* $$V\_{feedstock}$$ represents the total volume of feedstock mixture buried in m$$^3$$
* $$\rho\_{feedstock}$$ represents the density of feedstock mixture in tonnes/m$$^3$$
* $$M\_{%}$$ represents the moisture content of the feedstock mixture, on a weight basis (%w/w), so $$1-M\_{%}$$ represents the dry matter content of the feedstock mixture
* $$C\_{org,\ feedstock}$$ represents the organic carbon content in the feedstock mixture, in % mass (e.g. g organic carbon/g dry feedstock mixture). At validation, this value should be conservatively estimated.
* $$C\ to\ {CO}\_{2}$$ is 44/12 = 3.67, and represents the molar masses of CO$$\_2$$ and C respectively, and is used to convert tonnes C to tonnes of CO$$\_2$$eq.

$$\textbf{(Eq.3)}\ C\_{loss}=C\_{degrad} \times F\_{diffuse,\ 1000}$$

Where

* $$C\_{degrad}$$ represents the potential amount of carbon lost from degradation of buried feedstock mixture, in tonnes of CO$$\_2$$eq.
* $$F\_{diffuse, 1000}$$ represents the fraction of evolved CO$$\_2$$ from degradation of the buried feedstock mixture that diffuses upwards out of the sediment, into the overlying water column, and is eventually emitted to the atmosphere within 1000 years (as opposed to remaining trapped in the sediment, reincorporated into microbial biomass...). This is **conservatively assumed to be 1** for all projects (i.e. 100% of carbon lost from biomass is assumed to be emitted to the atmosphere, see [Assumptions](#snal78yaa2vf) section) even though site requirements minimize sediment diffusion.

$$\textbf{(Eq.4)}\ F\_{loss}= C\_{loss} \div C\_{buried}$$

Where

* $$F\_{loss}$$ represents the fraction of organic carbon originally buried that has been lost via degradation. If this is found to be >0.01 during 1-3 or 12 month monitoring (i.e. 1% of buried organic carbon has degraded), then the conservative models used at validation shall be applied to issue RCCs.

</details>

### Carbon degradation <a href="#fd0bgrymvc5j" id="fd0bgrymvc5j"></a>

The greatest risk to carbon removal reversal is degradation of buried feedstock mixture by microbes in the sub-sediment. This is limited by the site requirements that ensure anoxic conditions preventing degradation in the first place, and by sediment conditions ensuring that if degradation occurs, any evolved CO$$\_2$$ would stay trapped in the sub-sediment. Nevertheless, the calculations conservatively assume that any CO$$\_2$$ degraded is diffused out of the sub-sediment.

Carbon degradation is conservatively **modeled during validation** using a [multi-G kinetic model](#user-content-fn-10)[^10] (see [Appendix A](#appendix-a-scientific-basis-of-sub-sediment-biomass-storage) and [Example 1](#example-1-ghg-quantification-validation-modeling)), and **measured during verification**.

{% hint style="warning" %}
If monitoring measurements at 1-3 months or at 12-months show that >1% of buried organic carbon has been degraded and/or diffused, then the conservative models used at validation shall be applied to issue RCCs. See Eq. 4.
{% endhint %}

{% hint style="warning" %}
Empirical peer-reviewed research has only covered rate constants for organic matter degradation ($$k$$) for use in the [multi-G kinetic model](#user-content-fn-10)[^10] under marine sediment **oxic conditions**, but the projects covered under this methodology occur in marine sub-sediment **anoxic conditions**.&#x20;

In absence of resources covering anoxic conditions, a literature review is described in [Appendix A](#appendix-a-scientific-basis-of-sub-sediment-biomass-storage) using decades of research on analogous environments and describing the expected range of $$k$$ in anoxic environments.&#x20;

Nevertheless, oxic-environment rate constants are applied in ex-ante modeling here, which is a conservative approach because this is expected to overestimate potential degradation in the sub-sediment burial anoxic conditions. This methodology may be revised to account for new measurements of anoxic-condition rate constants.
{% endhint %}

<details>

<summary>Calculations: Carbon degradation</summary>

**During validation**, carbon degradation over 1000 years shall be calculated using the following [multi-G degradation model](#user-content-fn-11)[^11] to estimate provisional carbon credit volumes. The calculations are demonstrated in [Example 1](#example-1-ghg-quantification-validation-modeling) below.

$$\textbf{(Eq.5)}\ G(t,1000)=G\_{int,1,0}e^{-k\_{int1}t}+G\_{int,2,0}e^{-k\_{int2}t}+G\_{res,0}e^{-k\_{res}t}$$

$$\textbf{(Eq.6)}\ C\_{degrad}= C\_{buried}-(C\_{buried} \times G(t,1000))$$

Where

* $$t$$ represents time. The equations presented can be time-integrated from 0 to 1000 years, calculating carbon degradation/storage continuously. For the purpose of issuing RCCs under this module, only results at time $$t$$ = 1000 years are used.
* $$G(t,1000)$$ represents the fraction of organic carbon originally buried in the feedstock biomass remaining after 1000 years.
* $$G\_{int,1,0},\ G\_{int,2,0}$$ and $$G\_{res,0}$$ are the fractional pools (in tonnes of organic carbon) of intermediate 1, intermediate 2, and residual, described in Table 4.
* $$k\_{int1},\ k\_{int2}$$ and $$k\_{res}$$ are rate constants for each fractional pool, described in Table 4.
* $$C\_{degrad}$$ is described in Eq. 3.
* $$C\_{buried}$$ is calculated in Eq. 2.&#x20;

**During verification**, carbon degradation over 1000 years shall be calculated using the following equations to issue removal RCCs:

$$\textbf{(Eq.7)}\ C\_{degrad}= C\_{buried}-C\_{stored,\ t}$$

Where

* $$C\_{degrad}$$ is described in Eq. 3.
* $$C\_{buried}$$ is calculated in Eq. 2.&#x20;
* $$C\_{stored,\ t}$$ represents the organic carbon stored in the buried feedstock mixture at time $$t$$, either a first monitoring and sampling between 1-3 months after burial, or a second monitoring and sampling at least 12 months after burial, in tonnes of CO$$\_2$$eq. See [Crediting timeline and process](#vqih1nxeqk4n) for a description of the two time periods. This is calculated in Eq. 8.

$$\textbf{(Eq.8)}\ C\_{stored,\ t}=V\_{feedstock}\times \rho\_{feedstock,\ t} \times (1-M\_{%,\ t}) \times C\_{org,\ feedstock,\ t} \times C\ to\ CO\_2$$&#x20;

Where

* $$V\_{feedstock}$$ is described in Eq. 2, and is assumed to be the same at burial and at time $$t$$
* $$\rho\_{feedstock,\ t}$$ represents the density of feedstock mixture in tonnes/m$$^3$$ at time $$t$$
* $$M\_{%,\ t}$$ represents the moisture content of the feedstock mixture at time $$t$$, on a weight basis (%w/w), so $$1-M\_{%,\ t}$$ represents the dry matter content of the feedstock mixture at time $$t$$
* $$C\_{org,\ feedstock,\ t}$$ represents the organic carbon content in the feedstock mixture, in % mass (e.g. g organic carbon/g dry feedstock mixture) at time $$t$$
* $$C\ to\ CO\_2$$ was described in Eq. 2.

</details>

#### Example 1: GHG quantification validation modeling

{% hint style="success" %}
This example demonstrates the validation-stage, ex-ante carbon storage modeling for the burial of 1 tonne of CO$$*2$$eq ($$C*{burial}$$=1) at a sediment depth ($$X$$) of 5 m, using literature values from [Keil et al., (2010)](#user-content-fn-12)[^12] described in Table 4.

The literature values used here are intended to conservatively overestimate carbon loss, because they are taken from experiments under oxic conditions where degradation is more likely than in the anoxic conditions required under this methodology.&#x20;

Using equations 1-8 we obtain the the following results for $$C\_{stored,\ t}$$, also shown in Figures 3a and 3b below for 1 and 1000 years, respectively.

* $$C\_{buried}$$ = 1 t CO$$\_2$$eq
* $$C\_{stored,\ 1\ month}$$ = 0.999 t CO$$\_2$$eq
  * $$C\_{loss,\ 1\ month}= 1-0.999945=0.000055\ tCO\_2eq$$
  * $$F\_{loss}= \frac{C\_{loss}}{C\_{buried}}= \frac{0.000055}{1}= 0.000055= 0.0055%\ loss$$
* $$C\_{stored,\ 12\ month}$$ = 0.9993 t CO$$\_2$$eq
  * $$C\_{loss,\ 12\ month}= 1-0.9993=0.0007\ tCO\_2eq$$
  * $$F\_{loss}= \frac{C\_{loss}}{C\_{buried}}= \frac{0.0007}{1}= 0.0007= 0.07%\ loss$$
* $$C\_{stored,\ 1000\ years}$$ = 0.9093 t CO$$\_2$$eq
  * $$C\_{loss,\ 1000\ years}= 1-0.9093=0.0907\ tCO\_2eq$$
  * $$F\_{loss}= \frac{C\_{loss}}{C\_{buried}}= \frac{0.0907}{1}= 0.0907= 9.07%\ loss$$

In this case the estimated permanent carbon removal, over 1000 years, is 0.9093 tCO$$\_2$$eq. Induced emissions from other modules would be calculated and subtracted from this removal estimate to determine the number of provisional credits to make available.

* If, for example, upon monitoring, the Project Developer takes samples of the buried feedstock mixture and measured a $$C\_{stored,\ 12\ months}$$ = 0.9995 t CO$$*2$$eq. This represents an $$F*{loss}$$ of 0.05%, below the 1% threshold, so the project may issue RCCs based on the actual measured value of 0.9995 t CO$$\_2$$eq (adjusted by the induced emissions calculated in other modules).
* If, for example, the Project Developer measures a $$C\_{stored,\ 12\ months}$$ = 0.985 t CO$$*2$$eq. This represents an $$F*{loss}$$ of 1.5%, above the 1% threshold. The measurements are not used, it is considered that degradation has been triggered, and the project will issue credits based on their validation-stage estimates (i.e. 0.9093 t CO$$\_2$$eq.).
  {% endhint %}

<figure><img src="https://1461901304-files.gitbook.io/~/files/v0/b/gitbook-x-prod.appspot.com/o/spaces%2FE1FUJsBoIj20nqp3CtMf%2Fuploads%2FCr0GNrka6g1qCvoTPsRg%2Fcarbon%20modeling%201%20year.png?alt=media&amp;token=e76bd554-53b7-44f1-b1ed-422a0a3ac6a3" alt=""><figcaption><p>Figure 3a Carbon storage modeling results show the amount of carbon remaining one year after burying 1 tonne CO₂eq of biomass. The model assumes oxic conditions, providing a conservative estimate since the module requires anoxic storage, where degradation is much slower or non-existent.</p></figcaption></figure>

<figure><img src="https://1461901304-files.gitbook.io/~/files/v0/b/gitbook-x-prod.appspot.com/o/spaces%2FE1FUJsBoIj20nqp3CtMf%2Fuploads%2F87u6hCjRvohdC8ycFtxB%2Fcarbon%20modeling%201000%20years.png?alt=media&amp;token=769c84f3-712a-46a7-a961-2f7a8d0672fc" alt=""><figcaption><p>Figure 3b The same model as above, with results shown for the entire 1000 year modeling period. The results of this model at 1000 years is used for ex-ante storage estimates during validation, and applies if measured degradation exceeds 1% after one year</p></figcaption></figure>

## Assumptions <a href="#snal78yaa2vf" id="snal78yaa2vf"></a>

1. The entirety of buried biomass will be securely located in the seabed, allowing point-source monitoring of organic carbon degradation via measurement of organic carbon content.
2. Organic carbon degradation is [front-loaded and logarithmic](#user-content-fn-11)[^11]. 12 months is an appropriate and sufficiently long timeframe to determine how much carbon degradation (if any) will occur over 1000 years.
   1. Biomass degradation will either begin after embedding in the sub-sediment following a logarithmic relationship ([Keil et al., 2010](#user-content-fn-12)[^12]), or it will not occur at all.
3. The rate of organic carbon degradation under oxic conditions is greater than the rate under anoxic conditions.
4. Biomass degradation can be measured by tracking organic carbon content of samples of the buried feedstock mixture over time.
5. Storage points will not experience re-suspension or re-working such that burial biomass is exposed to the water column over 1000 years.
6. The site characteristics and requirements detailed in Table 1 are suitable to identify sub-sediment areas that are anoxic.&#x20;
7. Any organic carbon degradation from the buried biomass leads to CO$$*2$$ released to the water column, and eventually back to the atmosphere, via diffusive transport (see Eq. 4, $$F*{diffuse, 1000}$$ = 1). This is a conservative assumption, because degraded carbon may remain trapped permanently in the sediment matrix as CO$$\_2$$. Indeed, the site requirements are set to ensure that CO$$\_2$$ diffusion out of the sediment matrix is minimized.
8. Methane diffusion can be measured using oxygen penetration depth as a proxy. If O$$\_2$$ is measurable in the surface layer of marine sediments, methane is unable to diffuse out of the sediment-water interface.

## Uncertainty assessment <a href="#bwkjzyy06l35" id="bwkjzyy06l35"></a>

See general instructions for uncertainty assessment in the [Riverse Standard Rules](broken://pages/Wk9KF7HjB85QpUhAaMVB#uncertainty-assessment). The outcome of the assessment shall be used to determine the percent of RCCs to eliminate with the [**discount factor**](#user-content-fn-13)[^13].

The uncertainty in this module is assessed below for each component.&#x20;

{% tabs %}
{% tab title="Baseline" %}
The baseline scenario selection has low uncertainty: it is certain that the share of project technology occurring in a Business as Usual scenario is very low.
{% endtab %}

{% tab title="Equations" %}

* [Carbon storage](#cxpdobk03o90) modeling consists of basic conversions with low uncertainty.
* [Carbon degradation](#fd0bgrymvc5j) modeling consists of the [multi-G degradation model](#user-content-fn-11)[^11] at validation, with low uncertainty given that this is a foundational and commonly accepted model in biogeochemistry. At verification, this is modeled using direct measurements of changes in organic carbon content, leading to low uncertainty.&#x20;
  {% endtab %}

{% tab title="Secondary data" %}
The secondary data used for all projects under this methodology are the $$G$$ and $$k$$ constants presented in Table 4. The use of these constants has moderate uncertainty, because they are not specifically adapted to project storage sites. This uncertainty is mitigated and considered acceptable because:&#x20;

* they are conservative assumptions, representing oxic conditions where carbon degradation is assumed to be higher than in the anoxic conditions required for burial under the present module, and
* $$G$$ constants are only used at validation for calculating ex-ante estimates of carbon removal. These are replaced by measurements and primary data for verification and RCC issuance.
  {% endtab %}

{% tab title="Assumptions" %}
&#x20;**Low Uncertainty**

* Buried feedstock is securely stored in sub-sediment.
* Biomass degradation can be tracked by measuring organic carbon over time.
* Organic carbon degrades faster in oxic than anoxic conditions.
* The site traits outlined in Table 1 are suitable for identifying anoxic sub-sediment areas.
* Oxygen penetration depth can be used to estimate methane diffusion.

**Moderate Uncertainty**

* Organic carbon degrades quickly at first, following a logarithmic trend; 12 months is a suitable measurement period.
* Storage points remain undisturbed for 1000 years, preventing biomass exposure.
* Any degradation releases CO$$\_2$$ to the water, then the atmosphere, via diffusion (a conservative assumption).
  {% endtab %}
  {% endtabs %}

The uncertainty at the module level is estimated to be low. This translates to an expected **discount factor of at least 3%** for projects under this module.

## Risk evaluation template

:point\_right: Download the template [here](https://docs.google.com/spreadsheets/d/1DAE4-64Viy9Ns4S7Ytwt4vZv9Wuki6tki0gpaGNCm0c/edit?gid=1281724905#gid=1281724905)

{% embed url="<https://docs.google.com/spreadsheets/d/1DAE4-64Viy9Ns4S7Ytwt4vZv9Wuki6tki0gpaGNCm0c/edit?gid=260291865#gid=260291865>" %}

## Monitoring plan <a href="#snhouoxhyrzi" id="snhouoxhyrzi"></a>

The following information shall be provided for verification of each storage batch:

<table><thead><tr><th>Data/Indicator</th><th width="209">Purpose</th><th>Frequency of Measurement</th></tr></thead><tbody><tr><td>Volume of feedstock mixture buried per storage batch</td><td>To calculate <span class="math">C_{buried}</span></td><td>Each burial event</td></tr><tr><td>Organic carbon content of feedstock mixture</td><td>To calculate <span class="math">C_{buried}</span></td><td>Each storage batch: Day 1 and last day of burial, and 12 months post-burial (optional 1-3 months post-burial for <a href="#vqih1nxeqk4n">50/50 credit issuance</a>)</td></tr><tr><td>Moisture content of feedstock mixture</td><td>To calculate <span class="math">C_{buried}</span></td><td>Each storage batch, <a href="https://docs.riverse.io/~/changes/140/methodologies/biomass-carbon-removal-and-storage-bicrs/carbon-storage/marine-sub-sediment-burial#pre-burial-sampling">2x pre-burial</a> Each storage batch: Day 1 and last day of burial, and 12 months post-burial (optional 1-3 months post-burial for <a href="#vqih1nxeqk4n">50/50 credit issuance</a>)</td></tr><tr><td>Density of feedstock mixture</td><td>To calculate <span class="math">C_{buried}</span></td><td>Each storage batch, <a href="https://docs.riverse.io/~/changes/140/methodologies/biomass-carbon-removal-and-storage-bicrs/carbon-storage/marine-sub-sediment-burial#pre-burial-sampling">2x pre-burial</a> Each storage batch: Day 1 and last day of burial, and 12 months post-burial (optional 1-3 months post-burial</td></tr><tr><td>Visual proof of burial (e.g. photos or video taken during the burial event)</td><td>To confirm that the storage site is closed.</td><td>Each burial event</td></tr></tbody></table>

## Appendix <a href="#dk8b5sw92isc" id="dk8b5sw92isc"></a>

#### **Appendix A: Scientific Basis of Sub-Sediment Biomass Storage**

This appendix outlines the scientific foundation for sub-sediment biomass storage, summarizing key research on organic carbon degradation and preservation in marine sediments. While no studies directly replicate the conditions described in this module, relevant literature on similar processes is compiled.

#### **Introduction**

Marine sediments serve as the final carbon sink, storing 150–200 billion tons of organic carbon in their upper layers  ([Hedges & Keil, 1995](https://www.sciencedirect.com/science/article/abs/pii/030442039500008F); [Hedges, Keil & Benner, 1997](https://www.sciencedirect.com/science/article/abs/pii/S0146638097000661); [Atwood et al., 2020](https://www.frontiersin.org/journals/marine-science/articles/10.3389/fmars.2020.00165/full)). The **biological pump** transfers oceanic carbon to sediments via microbial fixation, food chain dynamics, and sinking particulate matter. Despite its inefficiency—only \~1% of sinking carbon reaches sediments, and just 0.1% is buried long-term ([Burdige, 2007](https://pubs.acs.org/doi/10.1021/cr050347q); [LaRowe et al., 2012](https://www.sciencedirect.com/science/article/abs/pii/S0016703711000378))—this process significantly influences atmospheric CO₂ levels.

Biomass degrades rapidly in oxygenated sediments, but in anoxic environments, it can persist for millennia. **Oxygen exposure time (OET)** controls degradation: prolonged exposure breaks macromolecules into labile forms, accelerating conversion to CO₂. Reducing OET preserves biomass, as seen in bog bodies and historic wooden structures preserved in compacted, oxygen-deprived sediments ([Ceccato et al., 2014](https://associazionegeotecnica.it/wp-content/uploads/2017/05/rig_2_2014_ceccato_analysis_of_degradation_effect_on_the_wooden_foundations_in_venice_.pdf); [Macchioni et al., 2016](https://www.sciencedirect.com/science/article/abs/pii/S0950061816302057)).

#### **Organic Carbon Preservation in Marine Sediments**

Decades of research ([Hedges & Keil, 1995](https://www.sciencedirect.com/science/article/abs/pii/030442039500008F); [Arndt et al., 2013](https://www.sciencedirect.com/science/article/abs/pii/S0012825213000512); [LaRowe et al., 2020](https://www.sciencedirect.com/science/article/pii/S0012825219305720?casa_token=Jn1H3dyaNnAAAAAA:Tgq2PF0zEmcw5lXn9Hhlo1yzRPWjMrywh2m_XnMCHGKUzdL3VhiNnBrUXyYf2qbnaZHWCnM1pM0)) indicate that organic carbon degrades slowly in anoxic sediments due to low substrate availability, microbial competition, mineral protection, and biochemical inaccessibility ([Kristensen & Holmer, 2001](https://www.sciencedirect.com/science/article/abs/pii/S0016703700005329); [LaRowe et al., 2022](https://www.sciencedirect.com/science/article/pii/S0012825219305720?casa_token=Jn1H3dyaNnAAAAAA:Tgq2PF0zEmcw5lXn9Hhlo1yzRPWjMrywh2m_XnMCHGKUzdL3VhiNnBrUXyYf2qbnaZHWCnM1pM0)).

Biomass preservation for over 1,000 years is common in coastal zones with high sedimentation rates and low OET. For example, rapid burial in the Bay of Bengal (30 cm/yr sedimentation) protects wood from microbial degradation, preserving organic material for millions of years ([Lee et al., 2019](https://www.pnas.org/doi/full/10.1073/pnas.1913714116)). Similarly, wood fragments up to 11,900 years old have been recovered from the Gulf of Mexico ([Schwab et al., 1996](https://pubs-geoscienceworld-org.libproxy.mit.edu/sepm/jsedres/article/66/5/916/98826/Sediment-mass-flow-processes-on-a-depositional)), and entire ancient forests remain buried off the Alabama coast ([Delong et al., 2021](https://onlinelibrary.wiley.com/doi/epdf/10.1111/bor.12524?getft_integrator=sciencedirect_contenthosting\&src=getftr\&utm_source=sciencedirect_contenthosting); [Moran et al., 2024](https://www.sciencedirect.com/science/article/pii/S0025322724001865)).

Studies show organic carbon degradation slows exponentially over time, with rates up to 1,000× lower in anoxic sediments than in oxic environments  ([Kristensen & Holmer, 2001](https://www.sciencedirect.com/science/article/abs/pii/S0016703700005329); [Keil et al., 2010](https://www.sciencedirect.com/science/article/abs/pii/S0304420310000903);  [LaRowe et al., 2012](https://www.sciencedirect.com/science/article/abs/pii/S0016703711000378); [Arndt et al., 2013](https://www.sciencedirect.com/science/article/abs/pii/S0012825213000512)). This supports the assumption that degradation rates in oxic conditions ([Keil et al., 2010](https://www.sciencedirect.com/science/article/abs/pii/S0304420310000903)) represent a worst-case scenario for anoxic sub-sediment burial.

#### **Biomass Degradation in Marine Sediments**

Biomass degradation begins with extracellular enzymatic hydrolysis, where aerobic microbes break down macromolecules into small organic compounds. These are further processed via anaerobic fermentation into substrates for redox reactions. However, without sufficient OET, enzymatic hydrolysis cannot begin, preventing degradation  ([Hartnett et al., 1998](https://www.nature.com/articles/35351); [Hedges et al., 1999](https://earth.geology.yale.edu/~ajs/1999/07-09.1999.02Hedges.pdf)). Ligno-cellulosic biomass requires longer OET than algal biomass to initiate breakdown.

In deep sediments, sulfate reduction is the dominant degradation process, accounting for 50% of total biomass decomposition globally (Jorgensen et al., 2019). This slow, energy-limited process produces CO₂ and hydrogen sulfide (HS). CO₂ diffuses upward, where it may be fixed by microbes or released at the sediment-water interface. Worst-case CO₂ diffusion rates align with modern dissolved inorganic carbon (DIC) fluxes ([Krumins et al., 2013](https://bg.copernicus.org/articles/10/371/2013/#:~:text=The%20model%2Dderived%20estimate%20for,0.1%20Pg%20C%20yr%E2%88%921.)). CO₂ accumulates due to compaction, it can form hydrates at depths >10 m in cold marine sediments (Eccles & Pratson, 2012; Velaga et al., 2011).

Hydrogen sulfide, though toxic, is rapidly oxidized in oxygenated environments, preventing marine toxicity. Additionally, 10–20% of HS reacts with iron hydrates to form pyrite (FeS), further stabilizing organic matter (Barber et al., 2017; Baumgartner et al., 2023).

Methanogenesis, consuming 15% of CO₂ from sulfate oxidation, contributes to organic carbon degradation (Regnier et al., 2011). Over time, sediment compaction reduces porosity, slowing diffusion and promoting FeS formation. This further limits CO₂ and methane movement, allowing microbial utilization.

#### **Conclusion**

Long-term biomass preservation in marine sediments is driven by **low OET, rapid burial, and anoxic conditions**. Anoxic degradation is significantly slower than oxic processes, enhancing the stability of buried carbon. Existing research supports the feasibility of sub-sediment biomass storage as a durable carbon sequestration strategy.

***

#### Appendix B Additional optional ESDNH indicators to monitor  <a href="#pcoc1dv4wl45" id="pcoc1dv4wl45"></a>

ESDNH indicators may be measured by the Project Developer within the validation stage to reduce project risk, and suggested monitoring during the verification stage.

To monitor environmental risk, Project Developers should understand the biogeochemical zonation of sediment depths where biomass is stored. In anoxic marine sediments, organic molecules degrade via sulfate reduction, producing hydrogen sulfide (H$$\_2$$S), which diffuses upward and oxidizes to sulfate in oxygen-rich layers. In the absence of sulfate, methanogenesis dominates, producing methane (CH$$\_4$$). Both processes can generate H$$\_2$$S or CH$$\_4$$, posing environmental risks.

* Hydrogen sulfide is toxic to benthic life, and excessive production may exceed oxidation rates, increasing ecological risk.&#x20;
* Methane, a potent greenhouse gas, can also impact benthic organisms if released.&#x20;

To mitigate risks, H$$\_2$$S and CH$$\_4$$emissions at the sediment-water interface should remain below environmental thresholds. Project Developers are encouraged to measure dissolved sulfate, H$$\_2$$S, and CH$$\_4$$concentrations in target sediment layers before burial and include these gases in their monitoring plans to ensure environmental safety.

**Suggested monitoring plan additions to monitor environmental harms**

| Data/Indicator                                                                                           | Purpose                                                                                                                                      | Frequency of measurement                                                           |
| -------------------------------------------------------------------------------------------------------- | -------------------------------------------------------------------------------------------------------------------------------------------- | ---------------------------------------------------------------------------------- |
| Dissolved hydrogen sulfide (H$$\_2$$S) in storage batch sediment porewaters at 1- and 12-month intervals | To detect microbial activity that might indicate increased environmental risk, even without %OC changes                                      | Each storage batch, 12 months after burial                                         |
| Dissolved sulfate in the sediment porewaters                                                             | To determine that the depth of storage has > 1 Mm of sulfate for organic carbon degradation to proceed using sulfate as an electron acceptor | Each storage batch, 12 months after burial                                         |
| Methane (if dissolved sulfate is not measurable)                                                         | To assess methane production, which would indicate the use of methanogenesis rather than sulfate reduction                                   | Each storage batch, 12 months after burial, if dissolved sulfate is not measurable |

***

#### Appendix C Reasoning for 2 m burial depth <a href="#dg5ezfux812d" id="dg5ezfux812d"></a>

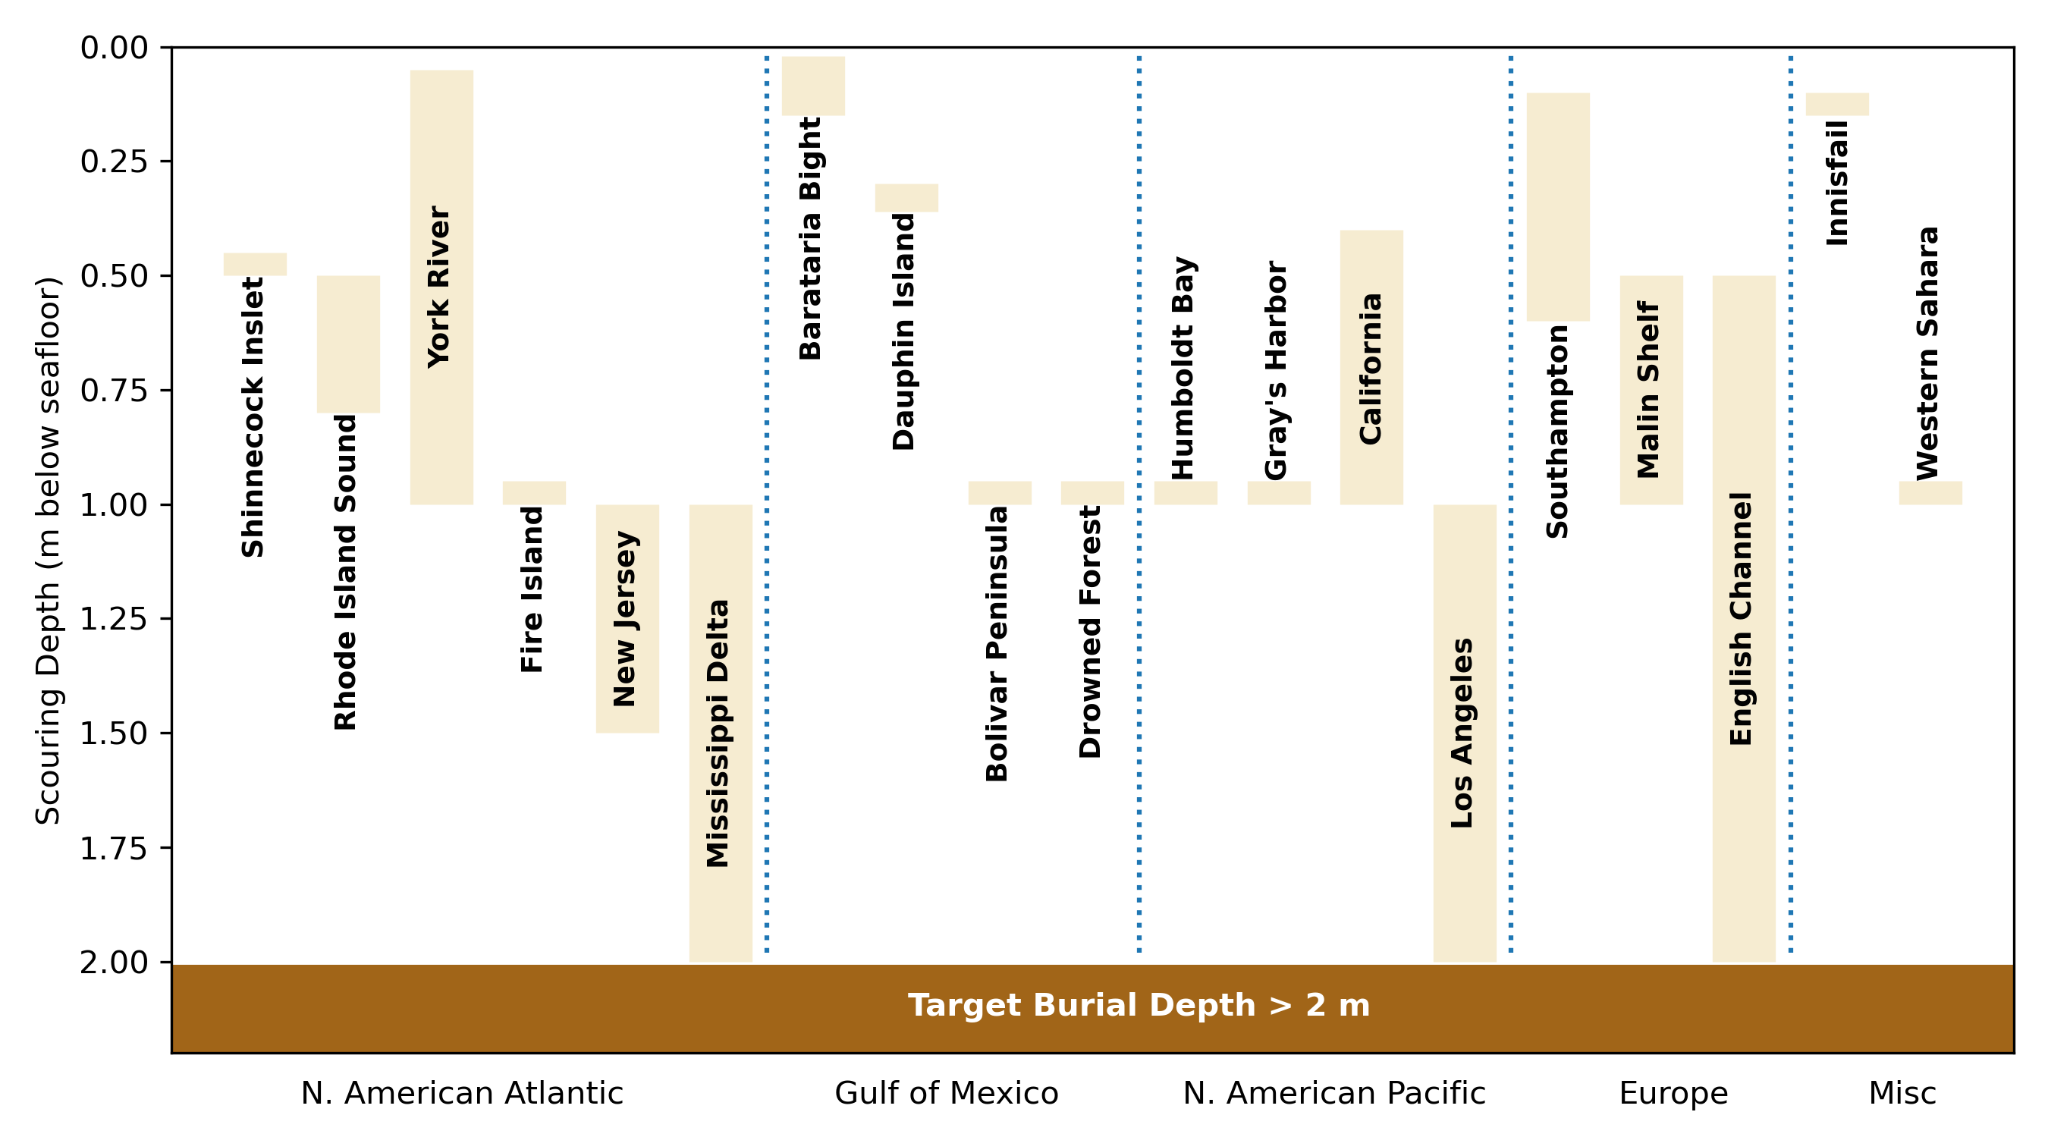
In addition to reaching below the maximum oxygen penetration depth at any season, there is a required sub-sediment depth of at least 2 m depth into the sediment is required due to risk of reversal, due to maximum 2m sediment scouring during tropical zones, and infilling of previously scoured areas due to resuspension due to storms ([Morton, 1979](https://www.researchgate.net/profile/Robert-Morton-9/publication/250082056_Temporal_and_Spatial_Variations_in_Shoreline_Changes_and_their_Implications_Examples_from_the_Texas_Gulf_Coast/links/60181d8892851c2d4d0bb75f/Temporal-and-Spatial-Variations-in-Shoreline-Changes-and-their-Implications-Examples-from-the-Texas-Gulf-Coast.pdf); [Sherwood et al., 1994](https://www.sciencedirect.com/science/article/abs/pii/0278434394900299)), fluid-mud flows ([Wheatcroft, 2000](https://www.sciencedirect.com/science/article/abs/pii/S0278434300000625)), and erosion ([Morton, 1979](https://www.researchgate.net/profile/Robert-Morton-9/publication/250082056_Temporal_and_Spatial_Variations_in_Shoreline_Changes_and_their_Implications_Examples_from_the_Texas_Gulf_Coast/links/60181d8892851c2d4d0bb75f/Temporal-and-Spatial-Variations-in-Shoreline-Changes-and-their-Implications-Examples-from-the-Texas-Gulf-Coast.pdf), [Harris & Wiberg, 2001](https://www.sciencedirect.com/science/article/abs/pii/S0098300400001229?via%3Dihub)).

On the continental shelf, seafloor sediments are eroded and reworked by bottom currents and wave action, a process known as “scouring” ([Flood et al. 1983](https://doi.org/10.1130/0016-7606\(1983\)94%3C630:COSFAA%3E2.0.CO;2)). This creates linear or lobate depressions shaped by dominant environmental forces. Channel-shaped scours, or furrows, range from 10–100 meters wide and 100–1000 meters long, with coarse sand or gravel floors. Larger lobate deposits (100–500 meters wide) are often filled with mega-rippled coarse sand, forming "Rippled Scour Depressions" ([Davis et al. 2013](https://doi.org/10.1016/j.csr.2013.09.010)). Major storms can also transport large amounts of sediment to the deep sea without leaving scours ([Teague et al. 2006](https://doi.org/10.1029/2005GL025281)).

Scouring and sediment resuspension pose risks to carbon storage in shelf sediments, as buried biomass must remain covered to prevent oxygen exposure. To assess this risk, we reviewed 29 studies on sediment furrows and ripple scour depressions across various depths and oceanographic settings (Figure 4, Table 5). Reported scour depths, including those from extreme events (e.g., Hurricanes Katrina, Ivan, Sandy), inform our recommendation of a >2-meter burial depth for carbon storage. While regional variation is significant, findings from [Ferinni et al (2005)](https://doi.org/10.1016/j.csr.2005.07.002) suggest that wider continental shelves may offer greater protection from erosion.

<figure><img src="https://1461901304-files.gitbook.io/~/files/v0/b/gitbook-x-prod.appspot.com/o/spaces%2FE1FUJsBoIj20nqp3CtMf%2Fuploads%2FSGHjaTwA7LH8iuSFDb1D%2F6.png?alt=media" alt=""><figcaption><p><strong>Figure 4 Summary of scour depths in sediment furrows and rippled scour deposits in shelf sediments.</strong> Vertical bars represent observed scour depth ranges. Observations are grouped by continent and ocean basin.</p></figcaption></figure>

**Table 5: Summary of observation of furrowing and rippled scour depressions in literature**

| **Location**                | **Water Depth** | **Scour Depth (cm)** | **Width (m)** | **Reference**                                                                                          |
| --------------------------- | --------------- | -------------------- | ------------- | ------------------------------------------------------------------------------------------------------ |
| Central CA, USA             | 30-70           |                      | 5-500         | [Cacchione et al. 1984](https://doi.org/10.1306/212F85BC-2B24-11D7-8648000102C1865D)                   |
| Onslow Bay, NC, USA         | 0-20            |                      | 20            | [MacIntyre et al. 1969](https://www.erudit.org/en/journals/ageo/1969-v5-n1-ageo_5_1/ageo05_1rep07.pdf) |
| Rio Balsas, Mexico          | 0-30            |                      | 50-100        | [Reimnitz et al. 1976](https://doi.org/10.1130/0091-7613\(1976\)4%3C395:PRCOFB%3E2.0.CO;2)             |
| Middle Atlantic Bight, USA  | 5-30            |                      | 10-100        | [Swift et al. 1978](https://doi.org/10.1306/212F7653-2B24-11D7-8648000102C1865D)                       |
| Southern Rhode Island, USA  | 0-10            |                      | 50            | [Morang et al. 1980](https://doi.org/10.1306/212F7AFE-2B24-11D7-8648000102C1865D)                      |
| Port Clarence, AK, USA      | 4-15            |                      | 10-500        | [Hunter et al. 1981](https://pubs.usgs.gov/publication/70011805)                                       |
| Southampton                 | 1-12            | 10-60                | 100-300       | [Flood et al. 1981](https://doi.org/10.1111/j.1365-3091.1981.tb01699.x)                                |
| California Coast, CA, USA   | 0-100           | 40-100               |               | [Davis et al. 2013](https://doi.org/10.1016/j.csr.2013.09.010)                                         |
| Shinnecock Inslet, NY, USA  | 3-9             | 50                   | 30            | [Ferrini et al. 2005](https://doi.org/10.1016/j.csr.2005.07.002)                                       |
| Gray's Harbor, WA, USA      | 10-16           | 100                  | 10-90         | [Ferrini et al. 2005](https://doi.org/10.1016/j.csr.2005.07.002)                                       |
| Humboldt Bay, CA, USA       | 16-36           | 100                  |               | [Ferrini et al. 2005](https://doi.org/10.1016/j.csr.2005.07.002)                                       |
| Rhone Island Sound, RI, USA | 0-42            | 50-80                |               | [McMullen et al. 2015](https://doi.org/10.1007/s00367-014-0392-0)                                      |
| Malin Shelf, Ireland        | 80-120          | 50-100               | 100           | [Evans et al. 2015](https://doi.org/10.1080/17445647.2014.956820)                                      |
| Drowned Forest, AL, USA     | 20              | 100                  |               | [Moran et al. 2024](https://doi.org/10.1016/j.margeo.2024.107402)                                      |
| Dauphin Island, AL, USA     | 60              | 30-36                |               | [Teague et al. 2006](https://doi.org/10.1029/2005GL025281)                                             |
| Innisfail, QLD, AUS         | 28-35           | 15                   | 40-150        | [Carter et al. 2009](https://doi.org/10.1016/j.margeo.2009.08.009)                                     |
| York River, VA, USA         |                 | 5-100                |               | [Dellapenna et al. 2001](https://doi.org/10.2307/1352946)                                              |
| Copper Harbon, MI, USA      | 100             | 50                   | 3-5           | [Viekman et al. 1992](https://doi.org/10.4319/lo.1992.37.4.0797)                                       |
| English Channel, UK         |                 | 50-200               | 10-20         | [Flood et al. 1983](https://doi.org/10.1130/0016-7606\(1983\)94%3C630:COSFAA%3E2.0.CO;2)               |
| Western Sahara              |                 | 100                  | 20            | [Flood et al. 1983](https://doi.org/10.1130/0016-7606\(1983\)94%3C630:COSFAA%3E2.0.CO;2)               |
| New Jersey, USA             |                 | 100-150              | 5-15          | [Flood et al. 1983](https://doi.org/10.1130/0016-7606\(1983\)94%3C630:COSFAA%3E2.0.CO;2)               |
| Los Angeles, CA, USA        |                 | 100-200              | 15-50         | [Flood et al. 1983](https://doi.org/10.1130/0016-7606\(1983\)94%3C630:COSFAA%3E2.0.CO;2)               |
| Mississippi, USA            |                 | 100-200              | 5-10          | [Flood et al. 1983](https://doi.org/10.1130/0016-7606\(1983\)94%3C630:COSFAA%3E2.0.CO;2)               |
| Bolivar Peninsula, TX, USA  | 3.5             | 100                  |               | [Goff et al. 2015](https://doi.org/10.1190/geo2014-0136.1)                                             |
| Fire Island, NY, USA        | 5-30            | 100                  |               | [Warner et al. 2017](https://doi.org/10.1016/j.csr.2017.02.003)                                        |
| Barataria Bight, LA, USA    | 10-40           | 2-15                 |               | [Allison et al. 2007](https://doi.org/10.1061/40926\(239\)67)                                          |

## Version history

This page describes the changes in the Marine sub-sediment burial module.&#x20;

<table data-full-width="true"><thead><tr><th width="237">Description of the change</th><th width="492">Justification</th><th width="165">Date</th><th>Version changed to</th></tr></thead><tbody><tr><td>Module created</td><td>--</td><td>February 2025</td><td>V1.0</td></tr></tbody></table>

[^1]: **Anoxic:** The absence of oxygen. In marine sediments, anoxic layers contain no detectable oxygen, as the rate of oxygen diffusion into these layers is slower than its consumption. In these conditions, microbial activity and organic matter degradation occur at significantly slower rates compared to oxic environments.

[^2]: A layer of sediment that is not exposed to the overlying water column, does not hold multicellular life and does not experience re-suspension. There is no exchange with marine water and the overlying water column.

[^3]: \>63um, as opposed to dissolved biomass

[^4]: L.J. Poppe, A.H. Eliason, J.J. Fredericks, R.R. Rendigs, D. Blackwood, C.F. Polloni, 2000. Chapter 1: Grain-size analysis of marine sediments: methodology and data processing. U.S. Geological Survey. [URL](https://pubs.usgs.gov/of/2000/of00-358/text/chapter1.htm).

[^5]: This has been determined because continuous burial over one calendar month is expected to cover at maximum 24 km$$^2$$, which was deemed an appropriate threshold for when sedimentary conditions likely change.

[^6]: If O$$\_2$$ is measurable in the surface layer of marine sediments, methane diffusion is unable to occur due to aerobic oxidation of methane ([Mao et al., 2022](https://www.nature.com/articles/s41467-022-35082-y)).  Aerobic oxidation of methane consumes the majority of evolved sedimentary methane before outgassing from marine sediments ([Dale et al., 2008](https://www.sciencedirect.com/science/article/abs/pii/S0012821X07006097?via%3Dihub); [Egger et al., 2018](https://www.sciencedirect.com/science/article/abs/pii/S0012821X07006097?via%3Dihub)).&#x20;

[^7]: Nevertheless, it shall be conservatively assumed that any measured organic carbon loss in buried feedstock mixture is emitted to the atmosphere as biogenic CO$$\_2$$ and the corresponding carbon removal is not permanent and not issued credits.

[^8]: self-sustaining gravity driven flow

[^9]: Keil, R.G., Nuwer, J.M., Strand, S.E., 2010. Burial of agricultural byproducts in the deep sea as a form of carbon sequestration: A preliminary experiment. Marine Chemistry 122, 91–95. [URL](https://doi.org/10.1016/j.marchem.2010.07.007).

[^10]: *The multi-G model is a canonical modeling tool used to conservatively assess organic matter degradation potential. The explicit assumptions in this model are that organic carbon degradation proceeds by multiple kinetic relationships with defined rate constants (k) and proportions of the organic matter that are degraded using discrete rate constants (k) that can be measured and modelled by assessing organic carbon degradation over extended temporal monitoring.*

[^11]: Arndt, S., Jørgensen, B.B., LaRowe, D.E., Middelburg, J.J., Pancost, R.D., Regnier, P., 2013. Quantifying the degradation of organic matter in marine sediments: A review and synthesis. Earth-Science Reviews 123, 53–86. [URL](https://doi.org/10.1016/j.earscirev.2013.02.008).

    \
    Stolpovsky, K., Dale, A.W., Wallmann, K., 2018. A new look at the multi-G model for organic carbon degradation in surface marine sediments for coupled benthic–pelagic simulations of the global ocean. Biogeosciences 15, 3391–3407. [URL](https://doi.org/10.5194/bg-15-3391-2018).

    Westrich, J.T., Berner, R.A., 1984. The role of sedimentary organic matter in bacterial sulfate reduction: The G model tested. Limnology and Oceanography 29, 236–249. [URL](https://doi.org/10.4319/lo.1984.29.2.0236).

[^12]: Keil, R.G., Nuwer, J.M., Strand, S.E., 2010. Burial of agricultural byproducts in the deep sea as a form of carbon sequestration: A preliminary experiment. Marine Chemistry 122, 91–95. [URL](https://www.sciencedirect.com/science/article/abs/pii/S0304420310000903).

[^13]: A percentage of verified Riverse Carbon Credits eliminated from each project and never issued. This acts as a safeguard against uncertainty in GHG reduction quantifications and overestimated carbon removal/avoidance.


---

# Agent Instructions
This documentation is published with GitBook. GitBook is the documentation platform designed so that both humans and AI agents can read, navigate, and reason over technical content effectively. Learn more at gitbook.com.

## Querying This Documentation
If you need additional information that is not directly available in this page, you can query the documentation by asking a question.

Perform an HTTP GET request on the following URL with the `ask` and `goal` query parameters:

```
GET https://docs.rainbowstandard.io/~/changes/140/methodologies/biomass-carbon-removal-and-storage-bicrs/carbon-storage/marine-sub-sediment-burial.md?ask=<question>&goal=<user_goal>
```

`ask` is the immediate question: it should be specific, self-contained, and written in natural language.
`goal` is what the user is ultimately trying to achieve, the reason they need the answer. Sharing it helps GitBook give you a better, more relevant answer. A goal is most helpful when it describes the outcome the user wants rather than restating the question. For example, with `ask=how do I create an API token`, a goal like `automate deployments from our CI pipeline` lets GitBook tailor the answer to that use case.

The response will contain a direct answer to the question and relevant excerpts and sources from the documentation.

Use this mechanism when the answer is not explicitly present in the current page, you need clarification or additional context, or you want to retrieve related documentation sections.